Data Visualization
Data visualization is the process of converting complex datasets into visual formats, such as charts, graphs, and dashboards, to make complex information more accessible and easy to understand. By representing data visually, it becomes easier to identify trends, patterns, outliers, and to gain insights. Effective data visualization helps decision-makers quickly grasp critical information, enabling data-driven strategies.
The Calibo Accelerate platform offers multiple options for data visualization.
-
You can use data from a data lake like Snowflake or data from an Analytical Data Store and visualize it using a tool like Qlik Sense.
-
You can use Angular, Java or React to create charts or graphs using data from a data lake like Snowflake and visualize the data.
To use Qlik Sense in your data pipeline, you must add a Data Visualization stage in the pipeline with a Qlik Sense node. You can connect a Qlik Sense node either to a Data Lake node or to an Analytical Data Store node.
In your data pipeline, you can add a Data Lake stage after a Data Source stage, Data Transformation stage, or Data Analytics stage depending on your requirements.
You can also add a supported RDBMS in Analytical Data Store stage after a Data Analytics stage. To configure an Analytical Data Store, see Configure RDBMS Connection Details.
Prerequisites
-
User Permissions in Qlik Sense: Ensure your user account is added in Qlik Sense with the following privileges.
-
To create shared or managed spaces in Qlik Sense from the Calibo Accelerate platform interface, you need:
-
Professional license
-
Tenant Admin or Analytics Admin role
-
-
To create a Qlik Sense app from the Calibo Accelerate platform interface, you need:
-
Professional license
-
Access to a personal space (assigned by default to all users in Qlik Sense)
-
Shared Space Creator role or Can edit role in a shared space
-
Can manage role in a managed Space
-
-
For more information on Qlik Sense roles and permissions, refer to the Qlik Sense documentation (The link resides outside help.calibo.com).
-
Qlik Sense Connection: Save your Qlik Sense connection details in the Cloud Platforms, Tools, and Technologies section and mark it as the default configuration. This lets the Calibo Accelerate platform know which Qlik Sense instance to connect to in the Data Visualization stage of your data pipeline.
-
Role in Calibo Accelerate platform: The Calibo Accelerate user who wants to visualize data using Qlik Sense must be assigned a system-defined or custom role having the required access to Qlik Sense.
Creating a Data Pipeline for Data Visualization
To understand how data visualization with Qlik Sense works in the Calibo Accelerate platform, as a simple example, let's create a data pipeline with the Data Lake and Data Visualization stages as mentioned in the following steps:
-
Add Data Lake Stage
This stores your data integrated from multiple sources. Currently, the Calibo Accelerate platform supports Snowflake as a data lake to be used with Qlik Sense for data visualization. Add and configure the Data Lake node using a Snowflake datastore. This node will serve as the source for Qlik Sense to generate visualizations.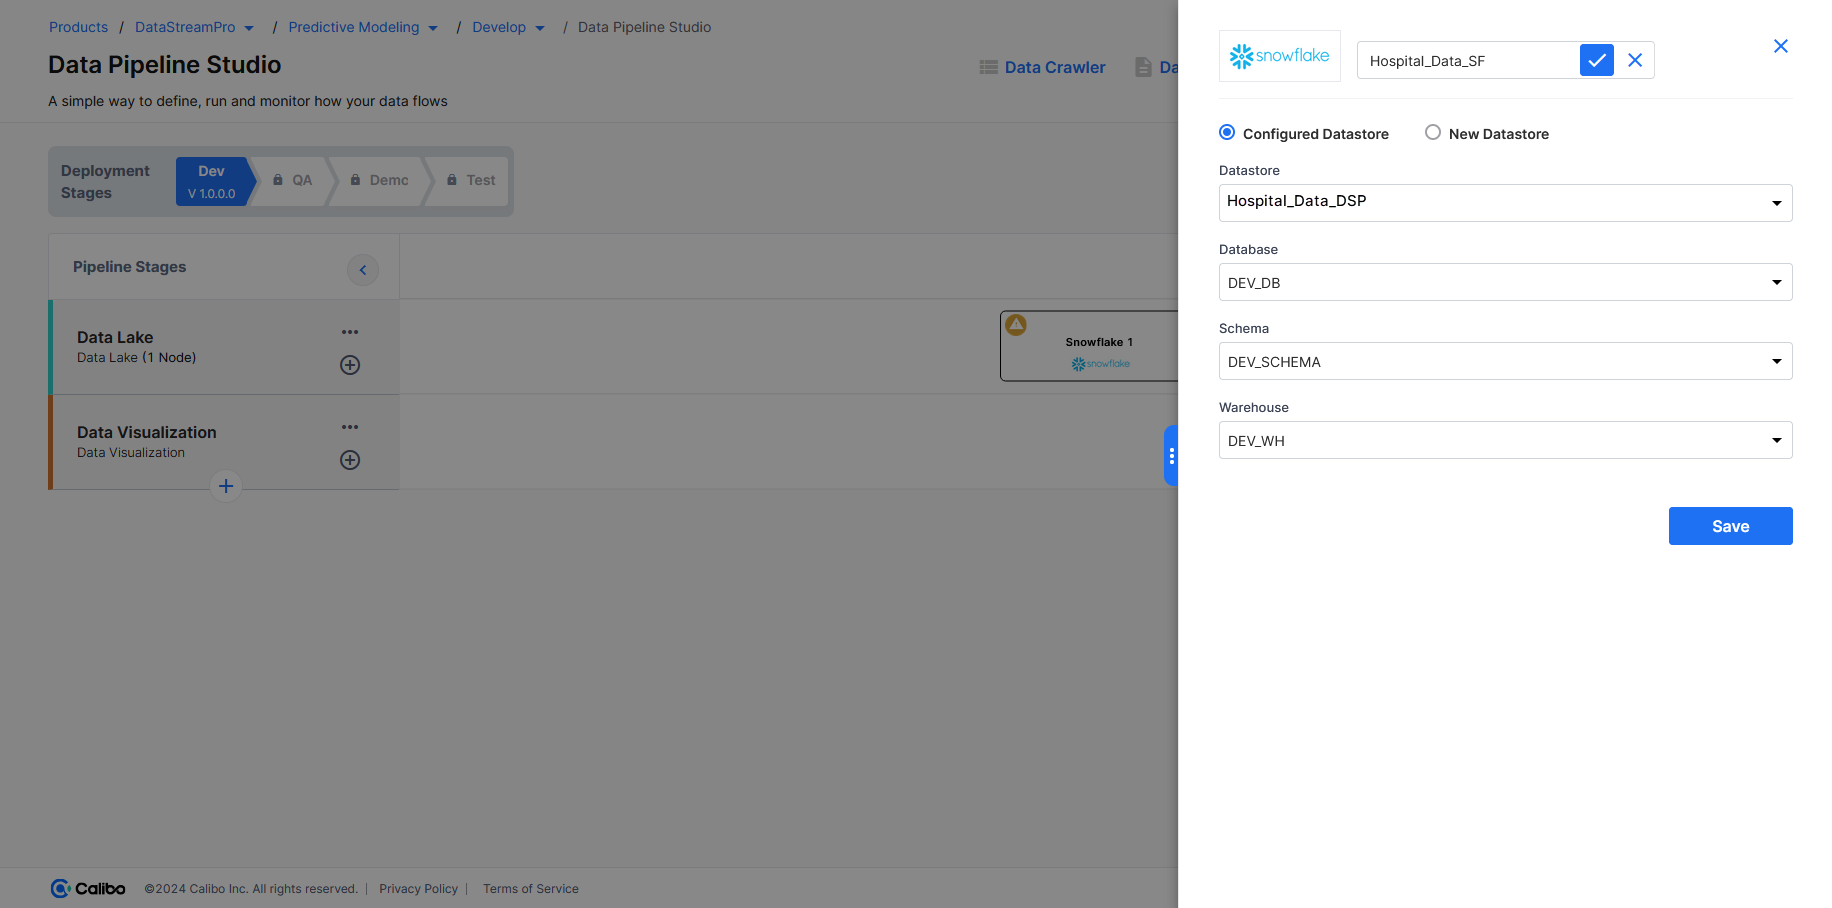
-
Add Data Visualization Stage
Add the Data Visualization stage, add a Qlik Sense node, connect your Snowflake Data Lake node to the Qlik Sense node. You can modify the default name of the node and save it. The Qlik Sense node that is marked as Default is configured.For more details on how to build a data pipeline, see Create a Data Pipeline.
-
Create Templatized Job
Click the Qlik Sense node. In the side drawer, click Create Templatized Job.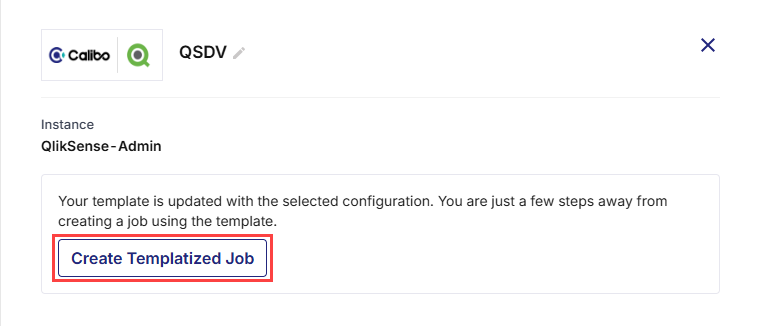
-
Provide Connector Name
Enter the desired Qlik Sense connector name. -
Select Qlik Sense Space
In the Select Space dropdown list, all the available spaces in your configured Qlik Sense account are provided. Select the one where you want to create the data connection, and click Next.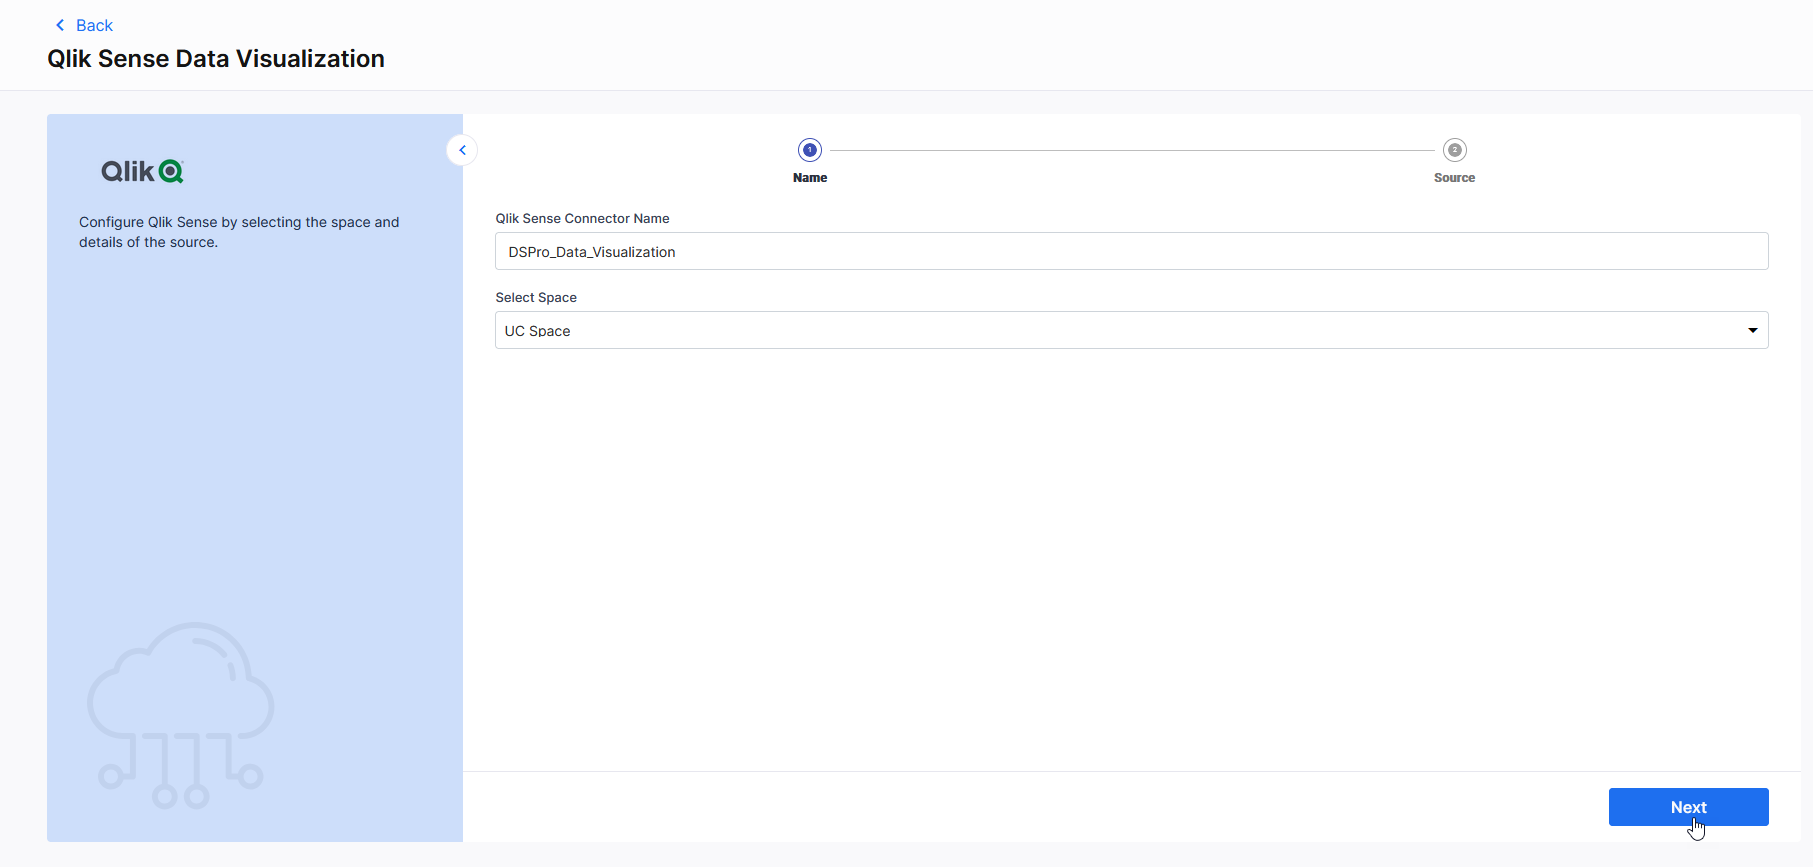
-
Review Source Details
In the Source section, review the configured details.
To modify the connector name or select a different space, click Previous. Otherwise, click Complete to proceed.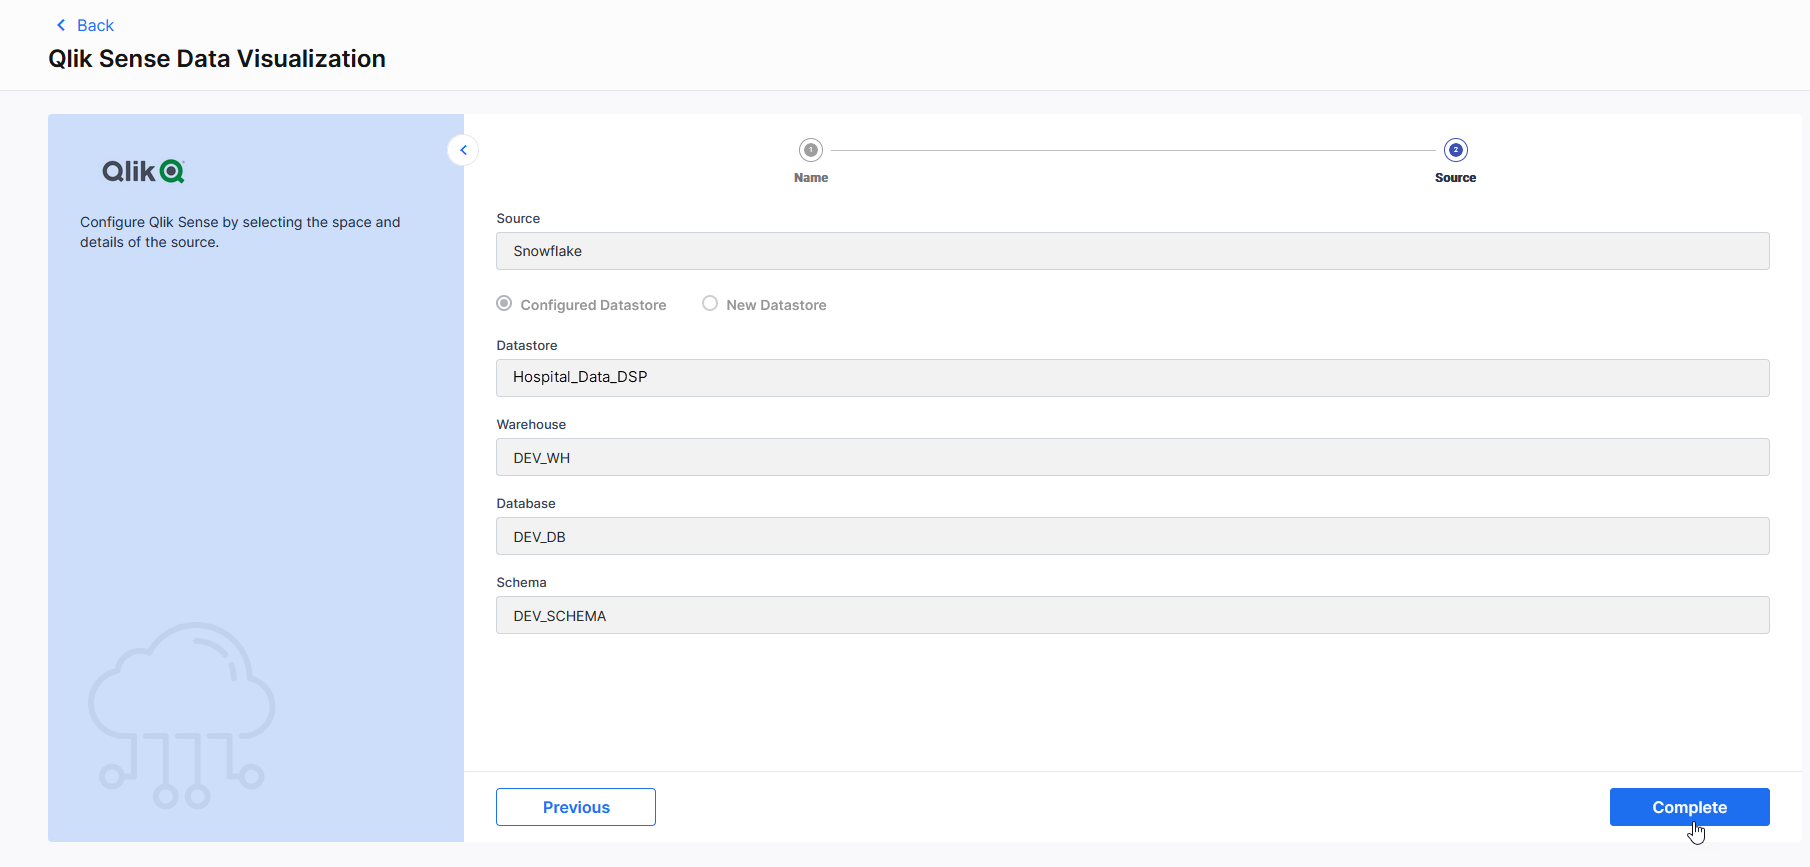
In the Data Pipeline Studio, your pipeline looks similar to the following:

-
Review Data Connection Details
At this point, the Calibo Accelerate platform has created a data connection in Qlik Sense on your behalf using Snowflake as a data source. To view the connection details, do the following:
-
Click the Qlik Sense node in your pipeline.
-
In the side drawer, in the Configured Data Sources section, click the ellipsis (...) in the data source details row and then do one of the following:

-
Click View Details. The data connection details are displayed in the view-only mode.
-
Click View in Qlik Sense to view the data connection in the Qlik Sense interface. Use your Qlik Sense user credentials to sign in.

Note:
To create a new Qlik Sense data connection, click Configure Data Source, provide a unique name to your connector, select the Qlik Sense space, review the source details and complete the procedure. This will replace your existing Qlik Sense data connection created from the Calibo Accelerate platform
-
-
-
Create an App in Qlik Sense from Calibo Accelerate
To visualize your data, create an app in Qlik Sense from the Calibo Accelerate platform. Do the following:
-
Click the Qlik Sense node in your pipeline.
-
In the side drawer, in the Configured Apps section, click Add New.
-
You can use an existing data space for your app or you may want to create a new one in Qlik Sense. To create a new space in Qlik Sense, click Create Space, provide a unique name to your space, provide an optional description, and click Create.
-
Click Create App, provide a name to your app, select the desired space, enter an optional description for the app, and click Create.
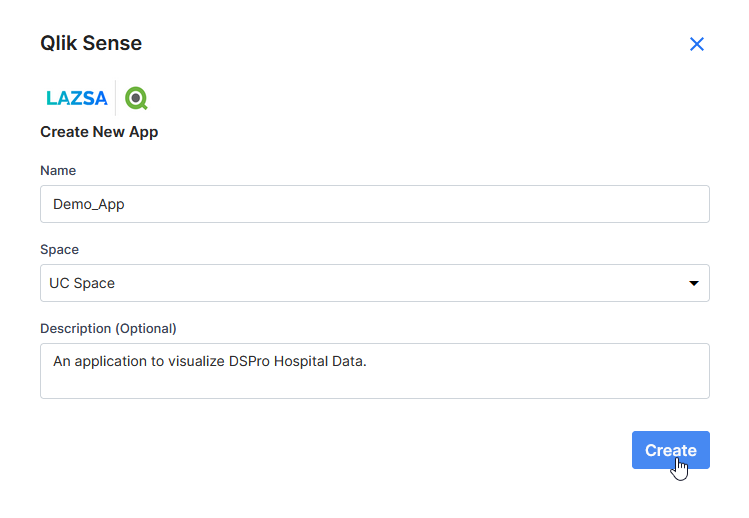
Your app is created in the specified space in Qlik Sense. The details of your Qlik Sense app are available in the Configured Apps section within your Qlik Sense node in the data pipeline.

Note:
For more details on apps, see the Qlik Sense documentation (The link resides outside help.calibo.com).
-
View App in Qlik Sense
After your app is created from within the Calibo Accelerate platform, to view it in Qlik Sense interface, do the following:
-
Click the Qlik Sense node in your pipeline.
-
In the side drawer, in the Configured Apps section, click the ellipsis (...) on the extreme right of the app details row.
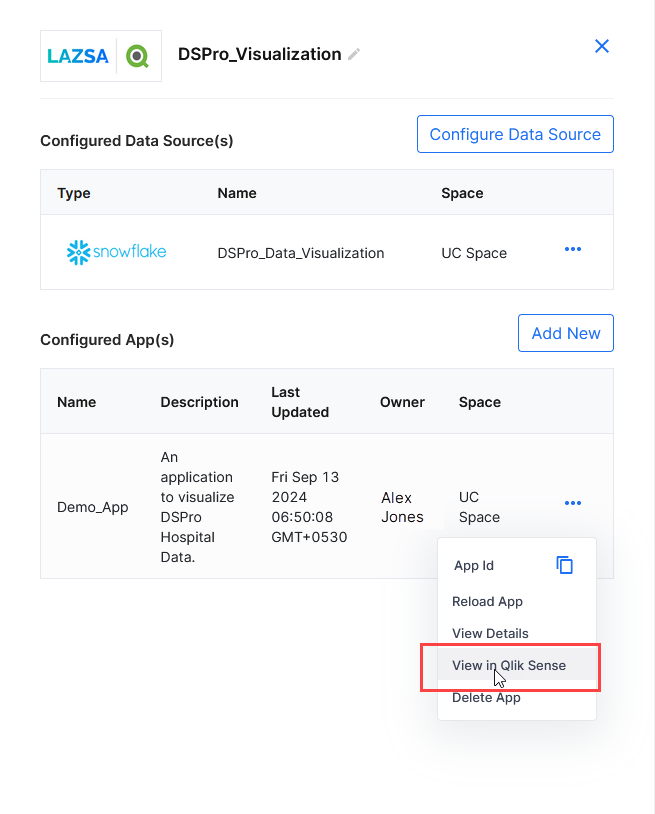
-
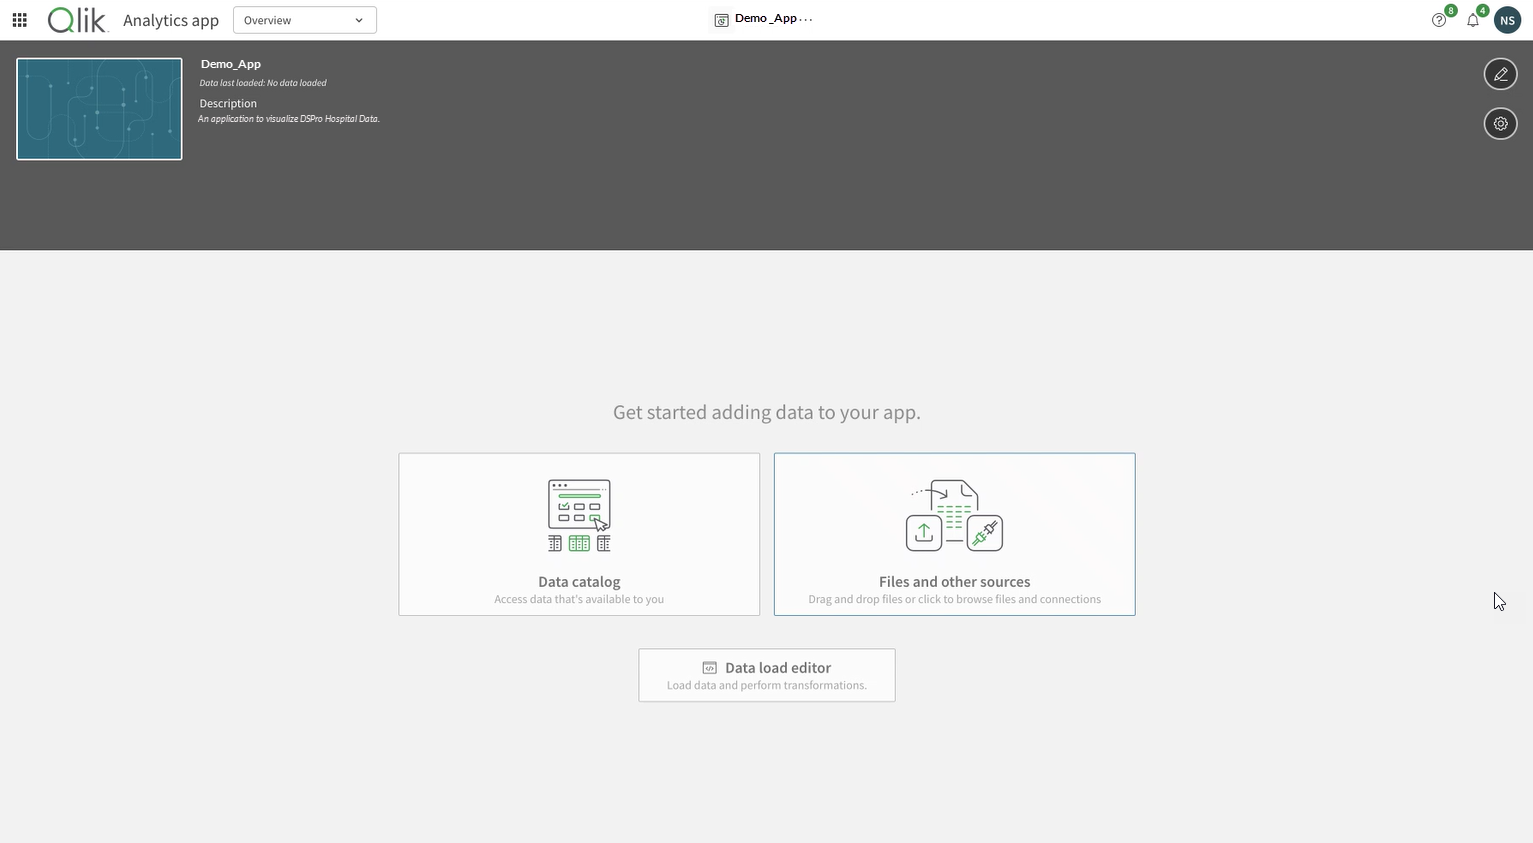
Sign in using your Qlik Sense credentials to access your newly created app.
-
Click Files and Other Sources to see your existing data connections within the space you selected for the app. To begin working with your data, use the Snowflake data connection (DSPro_Data_Visualization) available in the left panel to add data to your app.
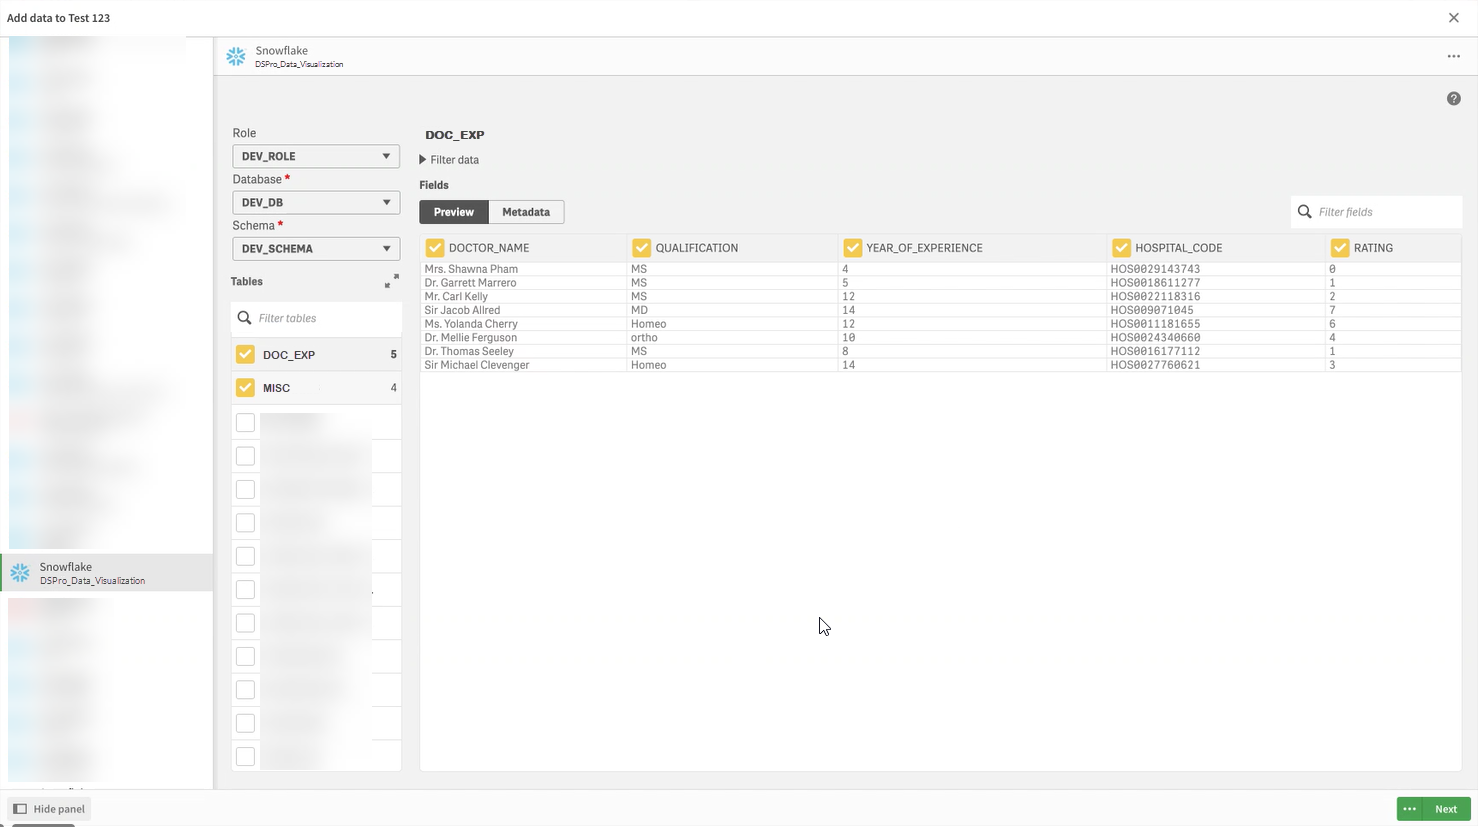
For further guidance on data management and app configuration, refer to the Qlik Sense documentation.
-
-
More Actions on Qlik Sense App from Calibo Accelerate Interface
To access the other app-related options in the Calibo Accelerate interface, do the following:
-
Click the Qlik Sense node in your pipeline.
-
In the side drawer, in the Configured Apps section, click the ellipsis (...) on the extreme right of the app details row. The following options are available:
Option Description App ID Copy the Qlik Sense application ID for future reference. Reload App Refresh the app with new data. View Details Review app details such as name, Qlik Sense space, and description. Delete App Delete the app from both Qlik Sense and the Calibo Accelerate platform.
-
-
By following these steps, you can easily integrate and visualize data using Qlik Sense on the Calibo Accelerate platform.
The Calibo Accelerate platform supports the creation of graphs and charts for data visualization. You can use technologies like Angular, Java, and React to build visualizations using data from a data lake, such as Snowflake, to display the graphs and charts on dashboards. Once the technologies are deployed in the Calibo Accelerate platform, you can start writing your own code to create graphs and charts.
What happens if the source node of the data visualization pipeline changes?
After creating a data visualization pipeline, if the source node (data lake or analytical data store) changes, the Qlik Sense node is considered as a dirty node and the indication is shown at the following locations:
-
The Qlik Sense node in the pipeline shows an icon with Configuration Changed status.

-
On clicking the Qlik Sense node, the side drawer shows a message that the configuration of the source node has changed.
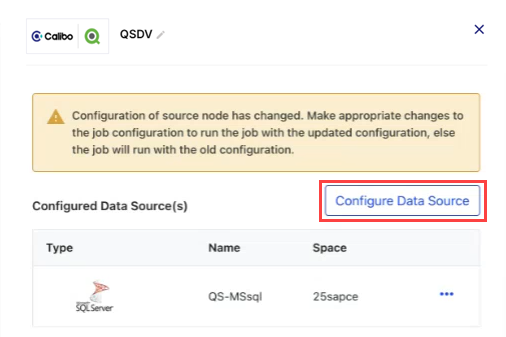
To change the configuration, click Configure Data Source. This navigates you to the job where you can make the required changes and update the configuration. Once the configuration is changed, the icon and the Configuration Changed status is no longer be visible.
| What's next?Data Analytics |