Publishing Technologies as Reusable Libraries
Calibo Accelerate supports publishing Maven-, Gradle-, or NPM-based technologies as reusable library artifacts to your configured JFrog Artifactory repositories. This capability enhances modularity, promotes code reuse, and accelerates application development by allowing teams to create, manage, and version shared libraries that can be consumed across microservices.
These libraries are not meant to be deployed independently but can be referenced by other microservices in the development lifecycle.
What Are Library Technologies and Why Use Them?
Library technologies refer to shared codebases intended for reuse across multiple microservices. Instead of duplicating functionality across applications, teams can maintain them centrally and publish versioned libraries to an artifact repository like JFrog Artifactory.
In a microservice architecture, this promotes:
-
Consistency:
Teams across the organization can rely on the same tested and verified utility methods, data models, or APIs. This ensures uniform behavior and structure across microservices, reducing discrepancies or integration issues. For example, a Core Java library might define standard exception classes, enums, and DTOs (Data Transfer Objects) that are reused across backend services. An Angular or React UI component library might define a common button, modal, or date picker with consistent behavior and styling across web applications.
-
Faster Delivery:
Developers can simply integrate existing libraries instead of rewriting common logic from scratch. This speeds up development cycles and helps teams focus on building unique application features. For example, a Node.js library with prebuilt logging middleware can be imported across multiple microservices without having to recreate log handlers for each.
-
Central Governance:
Library updates—such as bug fixes or enhancements—can be made centrally and rolled out to all consuming applications. This allows better control over code quality, dependency management, and deprecation of outdated features.
For example, a bug fix in a Java validation library used across microservices can be patched in one place, published as a new version, and consumed by all dependent applications, ensuring uniform fixes across environments.
-
Reduced Technical Debt:
When developers copy and paste code across projects, it leads to redundant maintenance and harder upgrades. Using libraries eliminates this "code duplication" and ensures a clean, maintainable code base with fewer long-term risks.
For example, instead of copy-pasting utility functions (for example, date formatters or API error handlers) in multiple React projects, developers can import them from a shared utility library. Any improvements or changes are made once and reflected everywhere.
Steps to Publish a Library-Type Technology
Prerequisites
Ensure the following repositories are created in JFrog Artifactory:
-
For Maven-based technologies: one local and one release repository
-
The local repository is used for internal development builds and preliminary validations
-
The release repository is used for production-ready, versioned artifacts that should not be overwritten
-
-
For Gradle- and NPM-based technologies: one local repository is sufficient
These ecosystems do not typically use separate release repositories, and artifact promotion workflows are managed within the local repository
-
Ensure you have configured the JFrog Artifactory connection details as an Artifact Management Tool in Calibo Accelerate.
-
Ensure appropriate repository permissions and credentials are configured
-
Sign in to the Calibo Accelerate platform, click Products in the left navigation pane.
-
On the Products screen, choose your desired product and the feature within the product, where you want to add technologies.
-
In the phases of the selected feature, click Develop.
-
On the Develop screen, click + New Technologies. If you haven't created a branch template yet, you'll be prompted to do so before adding a technology.
To create a branch template as per your branching strategy, click Configure Branch Template. See Create Branch Template.)
If you choose to do it later, click Proceed.
-
On the Add Technologies screen, search and select a Maven-, Gradle-, or NPM-based technology and click Add.
-
In the pop-up, enter basic details like Technology Title, Repository Name, Group, and Visibility.
-
Select the Publish as Library checkbox.

-
Click Save.
The added technology now appears with the Library tag on the Develop screen. This distinguishes it from regular runtime services and indicates that the technology is intended for reuse as a shared code component.

You can begin developing your library just like you would with any source-managed project. The following options are available:
-
Start Coding: Launches Visual Studio Code so you can begin implementing features or modules within the library project.
-
Source Code: Opens a direct link to the source code repository created by Calibo Accelerate in your configured source control platform (such as GitHub, GitLab etc.) The repository is initialized automatically with:
-
A standard project structure (src, README.md, etc.)
-
CI/CD setup files (Jenkinsfile, Dockerfile, pom.xml, or package.json)
-
Configuration files for tools like Sonar, Git, NPM, etc.
-
-
Build: Once feature development is complete, click Build to proceed to the Deploy phase. This is where you configure and trigger the CI pipeline to publish the library artifact.
-
On the Deployment Workflow screen, on a stage tile (for example, Dev stage), click the ellipsis (...) and then click Edit Details

-
In the Edit Stage side drawer, in the Library Artifact Repository Tool (optional) list, the JFrog Artifactory configurations saved in your Calibo Accelerate platform tenant are listed. Select the one where you want to publish library artifacts.

Note:
The Library Artifact Repository Tool option appears only when at least one Library technology exists in the Develop phase.

-
Click Save to confirm your changes.
-
Click CONFIGURE on the stage tile to proceed.
-
On the Deployment tab under the selected stage, expand the Technologies Published as Library Artifacts section, and click Add Technologies. The technologies you marked as libraries in the Develop phase are listed here.
-
Select your desired library technology and click Add.

If you do not select an artifact management tool in the stage configuration, the following error message is displayed:

To proceed, edit your deployment stage configuration and select the artifact management tool where the library artifacts should be published.
-
In the side drawer, in the Continuous Integration section, select the source code branch from the available list, or enter a new branch name to create one. This is the branch from which the CI pipeline will fetch the latest source code to build the library.
-
In the Publish Library Artifact section, configure the target repositories in JFrog Artifactory:
-
For Maven-based technologies: Select both the Local and Release repositories.
Maven requires both to support development lifecycle and version promotion.

-
For Gradle- and NPM-based technologies: Select the local repository only.
These toolchains generally publish directly to a local repository, and versioning is managed within the project.

Note:
Through a policy template, your administrator can restrict library publishing to specific repositories to enforce governance. If a policy template is applied to the product, only repositories allowed in that template will appear in the dropdown for selection.
-
-
Choose how and when the CI pipeline should be triggered:
-
Code Change (default): Automatically triggers the CI pipeline whenever code is committed to the selected branch. Ideal for active development scenarios.
-
Manual: The pipeline must be explicitly triggered by a user. Recommended when publishing is tightly controlled or on-demand.
-
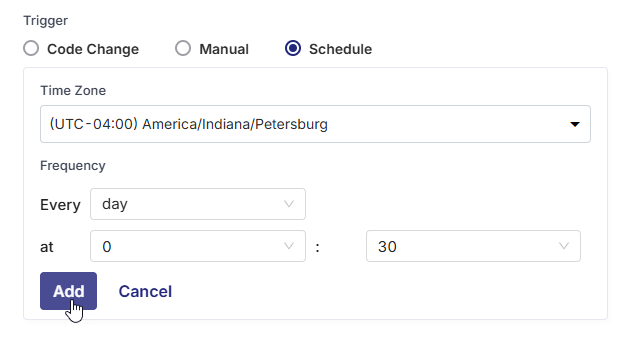
Schedule:You can define one or more time-based schedules to run the CI pipeline automatically at specific times. Useful for batch publishing, routine library validations, or nightly builds.
In each schedule, you can specify the following:
-
Time Zone: Select the desired time zone for the CI trigger schedule.
-
Frequency : Select the Every Day or Every Week option as required.
-
Time: Define when to trigger the pipeline (in hours and minutes). You can define multiple schedules as well.
-
-
-
Click Add to complete the CI configuration. The technology is added to the Technologies Published as Library Artifacts section and now you can build and publish the library based on your chosen trigger strategy.
-
In the Technologies Published as Library Artifacts section, click the ellipsis (...) next to the library technology.
-
From the dropdown, select Run Build to trigger the CI pipeline.
-
Wait for the CI pipeline to complete. After the successful CI run, a green CI checkmark appears next to the library.

-
Click View Details to access the following:
-
On the Basic Details tab, you can access the following links:
-
CI Pipeline:
A link to the detailed build job triggered by the selected CI/CD tool. From here you can:
-
Monitor pipeline execution logs, build stages, and task durations
-
Identify failures, test results, or warnings during the build or publish steps
-
Verify trigger sources (commit ID, schedule, or manual run) and build metadata
-
Download logs or view historical builds for debugging or audit purposes

-
-
Artifactory:
A link to the published artifact in the associated JFrog repository. As shown in the following screenshot, the artifact angular19-0.0.0.tgz is listed along with its version, size, last modified timestamp, and a direct download link.
This confirms successful publication of the library artifact.

The links displayed depend on the library’s build tool:
-
For Maven: Two separate links are available:
-
Artifactory Local: Where intermediate or development versions are stored.
-
Artifactory Release: Where production-ready, versioned artifacts are published.
-
-
For Gradle and NPM: A single link is shown to the associated local repository, as these ecosystems typically manage artifacts through one consolidated repo.
-
-
-
On the Continuous Integration tab, you can view the details such as the selected source code branch and the CI pipeline trigger.
-
-
Click the ellipsis (...) next to the library technology to access the following additional options:

-
Remove
Click this option to delete the CI configuration for the selected library technology.
A confirmation prompt is shown before removal. After you confirm, the library entry is removed from the Technologies Published as Library Artifacts section, but the technology itself remains in the Develop phase.
-
Edit Details
Click this option to edit the following CI configuration details for the library technology:
-
Source code branch
-
Repository mappings
-
Trigger type (Code Change / Manual / Schedule)
-
-
From the CI/CD Pipeline tab within a deployment stage, you can monitor the progress and status of the CI pipeline of your library technology directly — without switching to external tools. Library-type technologies are distinguished with the Library tag, making it easy to differentiate them from containerized runtime services. This ensures better visibility and tracking of reusable components versus deployable workloads.
In the CI configuration for a library technology, the pipeline is composed of the following predefined stages:
-
Checkout SCM
-
Initialization
-
Build
-
Unit Tests
-
SonarQube Scan
-
Publish Artifact
Each stage is marked with a success/failure indicator, helping you quickly identify where a failure occurred, if applicable.

You can add, rename, or reorder most of the stages to align with your team’s CI workflow. However, the Initialization stage is mandatory for the Calibo platform to function correctly and is required for packaging and publishing the artifact to JFrog Artifactory. If needed, you can insert additional stages between predefined ones.
Hover over any stage to view the stage name, execution status (Passed/Failed), and duration of the stage run.

Hover over the SonarQube Scan stage for a quick view of metrics such as Code coverage, Number of tests, Code smells, and Vulnerabilities. Access the link to view the detailed scan report in SonarQube.

Click View Job to view the CI/CD pipeline job details page (Jenkins or GitHub Actions).
Click the graph icon ![]() to navigate to the Monitoring > CI/CD Pipeline tab. View high-level analytics related to pipeline health, failure trends, and performance metrics.
to navigate to the Monitoring > CI/CD Pipeline tab. View high-level analytics related to pipeline health, failure trends, and performance metrics.
On the Source Code tab within a deployment stage, you can view the commit history of all technologies included in that stage. Technologies published as libraries are clearly marked with a Library tag, allowing you to distinguish them from containerized workloads.
When you select a library, the commit history is displayed with details such as the commit message, author, timestamp, and commit ID. The source code branch is shown at the top. You can click the commit comment to open the corresponding commit in the integrated source code repository tool. The commit ID appears on the right corner of each entry for quick reference.

Additionally, clicking the graph icon ![]() in the upper-right corner navigates you to the Monitoring > Code Quality tab, where you can access the following visual insights:
in the upper-right corner navigates you to the Monitoring > Code Quality tab, where you can access the following visual insights:
-
Commits
-
Pull Requests
-
Number of Commits by Contributors
-
Line Code Coverage
-
Repositories by Quality Gates
-
Repositories by Overall Code Coverage
-
Repositories by Duplications
-
Issues by Repositories
-
Issues by Type
-
Bugs by Severity
For more information, see Monitoring: Code Quality.
On the Audit History tab, you can view the audit trail related to library technologies within the selected product and stage. It captures details of actions performed, such as job creation and execution, along with timestamps and the user who initiated the activity. Expanding a row reveals additional context, including the product name, feature, stage, and release associated with the event. This comprehensive audit trail helps teams maintain traceability and accountability for changes made to library CI configurations and executions.