Monitoring: Code Quality
The Code Quality tab of the Monitoring section provides statistics related to bugs in the repositories, drill-down by type of bugs, code coverage through unit testing, or the completion of pull requests. It gives you an idea about the overall security issues in code repositories, and best practices being followed by the team. You can view statistics for a selected product, features, tech stack repositories, and branch for the specified timeline.
| Commits - trend of number of commits done in a specific period. |
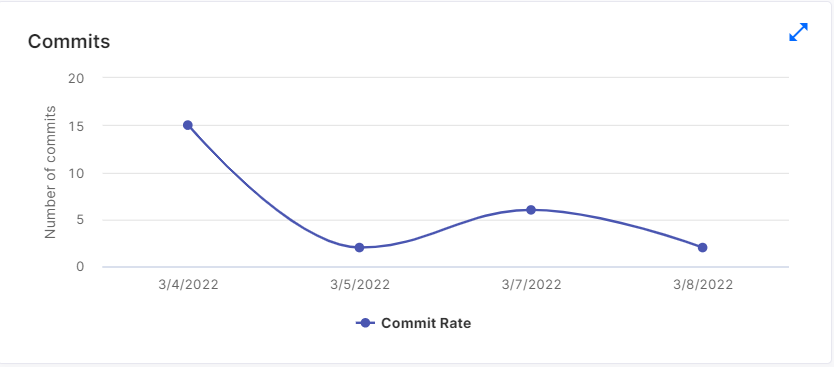
|
| Pull Requests - number of pull requests raised and completed in a specific period. It also shows the number of pull requests created and merged. |
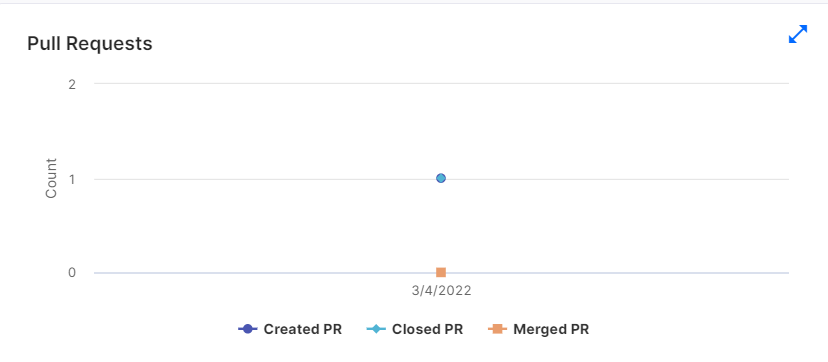
|
| Number of Commits by Contributors - code commits done by various developers in the team. |
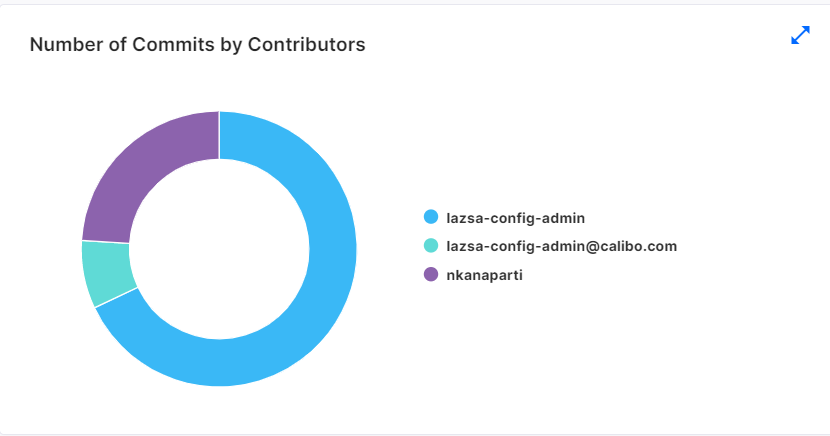
|
| Line Code Coverage - number of lines of code across one or multiple repositories that are covered through unit testing. It shows the total lines of code and number of unit tests run across the code. |
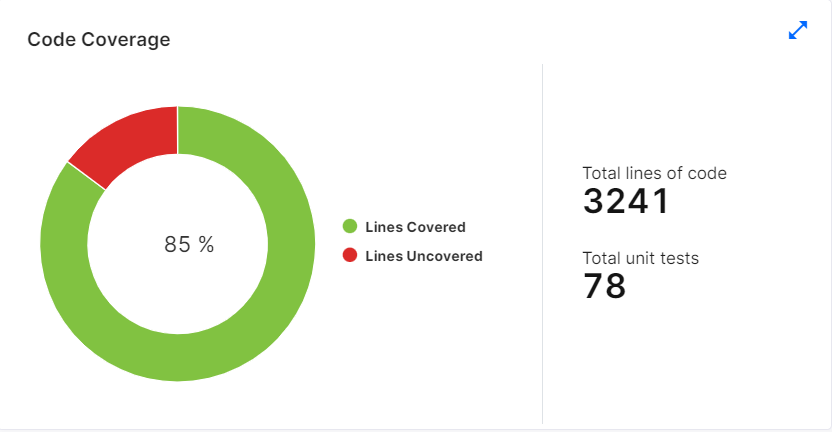
|
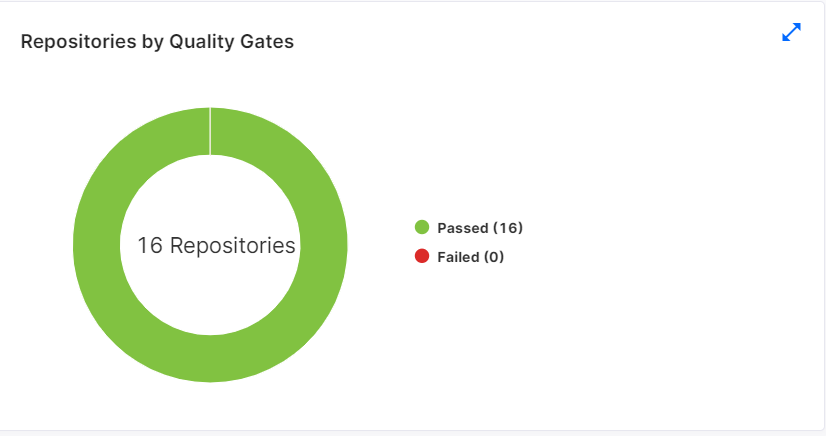
| Repositories by Quality Gates - the distribution of passed and failed repositories while passing through various quality parameters (also called as quality gates). |
|
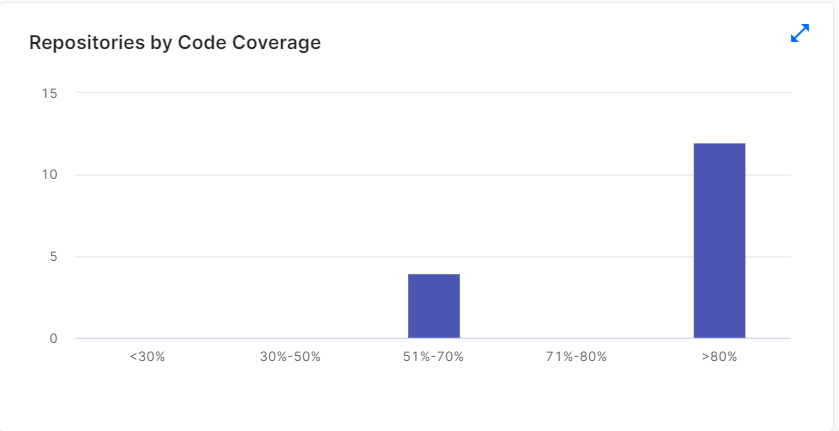
| Repositories by Overall Code Coverage - range of code coverage of various repositories. For example if you hover over the bar graph for >80% you see a list of repositories for which unit test coverage of code is more than 80%. |
|
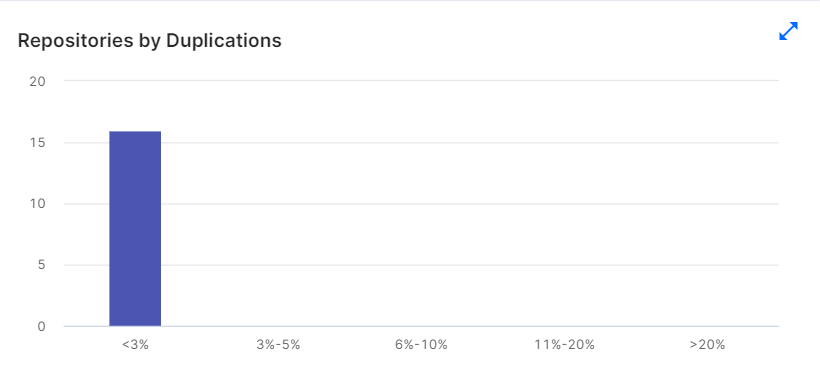
| Repositories by Duplications - range of repositories that have the specified percentage of code duplication. Hover over a range, say <3% and you see a list of repositories that have less than 3% code duplication. |
|
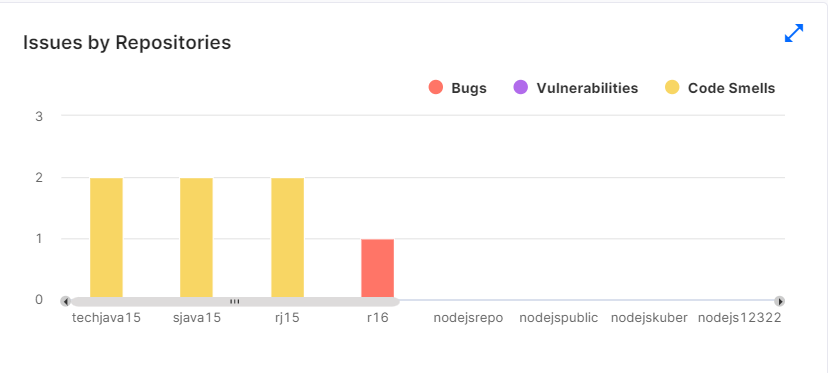
| Issues by Repositories - number of bugs, vulnerabilities, and code smell for each repository. |
|
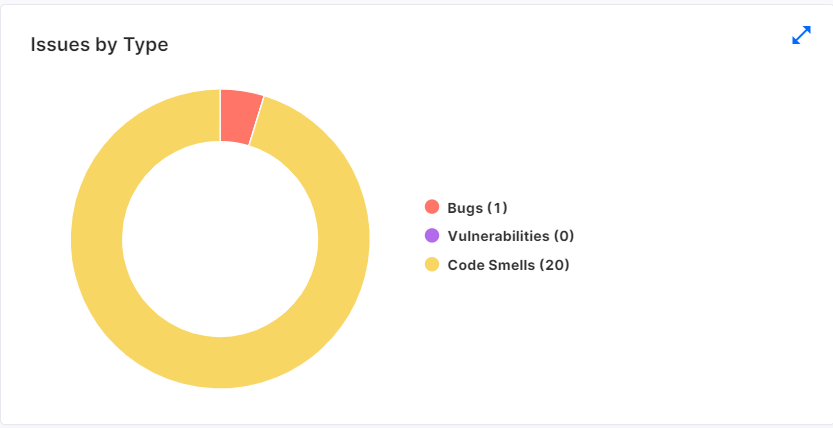
| Issues by Type - overall number of bugs, vulnerabilities, and code smells across repositories. |
|
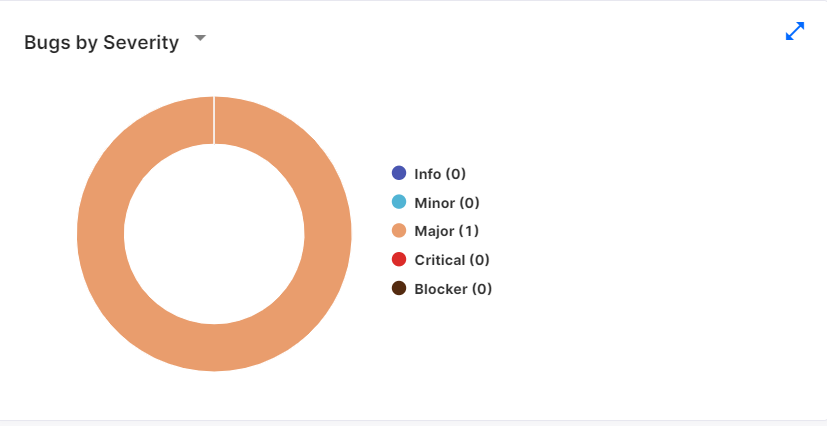
| Bugs by Severity - overall distribution of bugs according to the severity - info, minor, major, critical, blocker. |
|
| What's next? Monitoring: CI/CD Pipeline |