Monitoring: CI/CD Pipeline
The CI/CD Pipeline tab of the Monitoring section helps you track the health and efficiency of pipelines to ensure continuous delivery to your customers. The various widgets provide visibility into statistics such as average pipeline execution time, pipeline failure rate, deployment failure rate, build failure reasons for a specific timeline and selected product, feature, repository, stage. These granular insights help you improve the overall efficiency of your pipeline.
The widgets of the CI/CD pipeline dashboard display the following information:
| Pipeline Execution - the number of pipelines executed during a specific time period. |
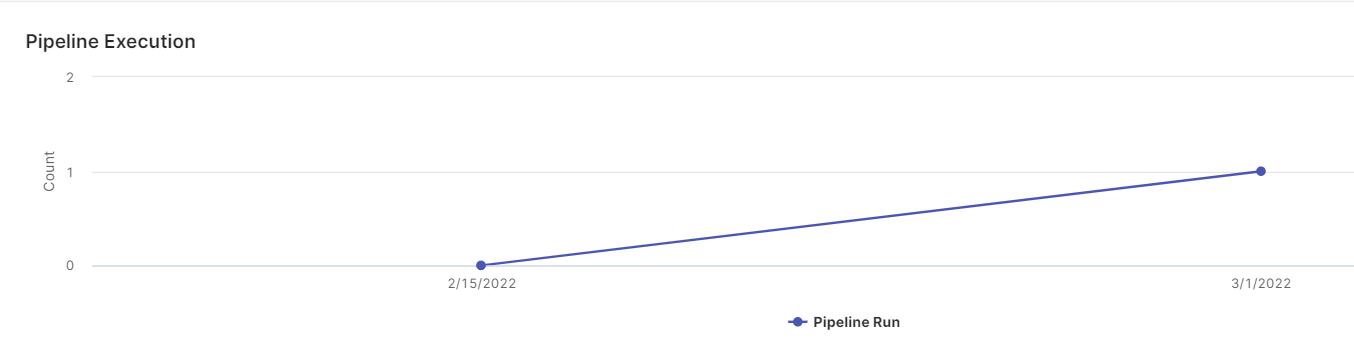
|
| Pipeline Frequency vs Failure Rate - the number of pipeline runs versus failures for a specific time period. |
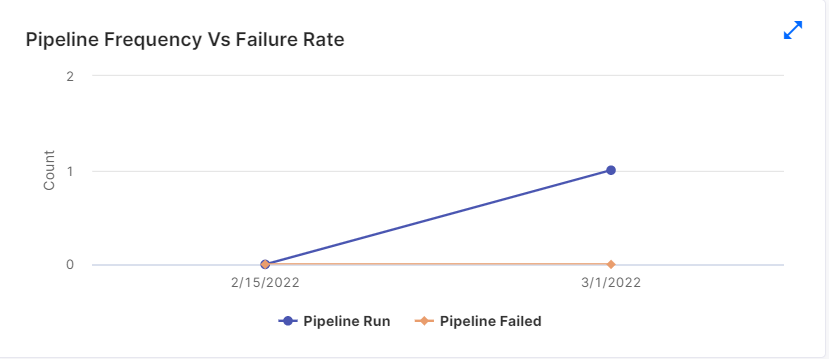
|
| Deployment Frequency vs Failure Rate - the statistics of frequency of deployment for a stage versus failure rate. |
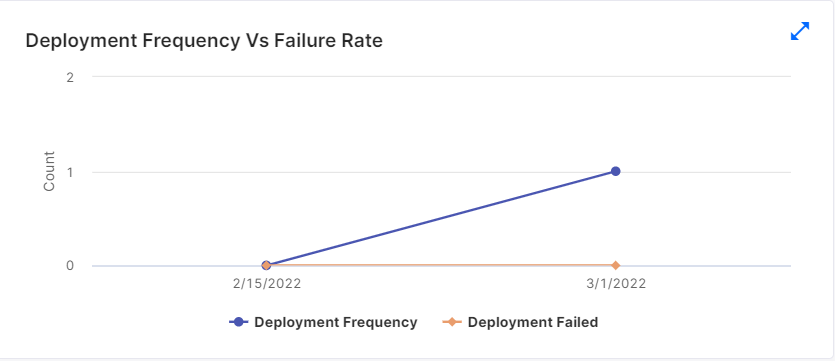
|
| Average Pipeline Execution Time - average time required for execution of pipeline in the selected stage. |
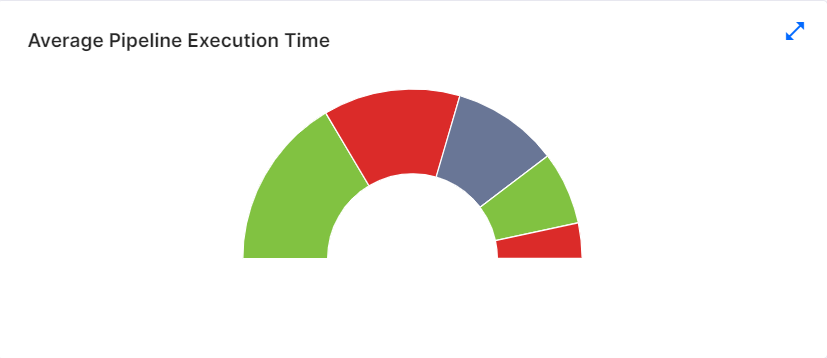
|
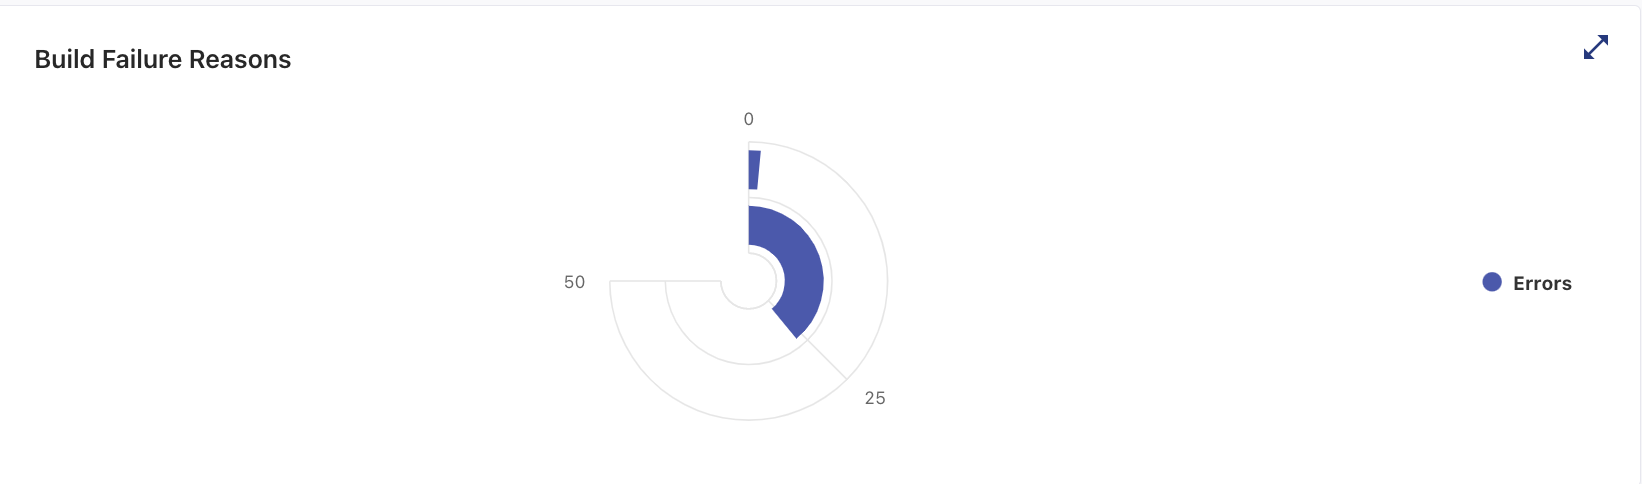
| Build Failure Reasons - Reasons for build failures. |
|
| What's next? DataOps |