DataOps
The DataOps tab of the Monitoring dashboard provides insights related to records processed, data pipelines created, pipeline executions and failures, promotion of pipelines across stages and various other aspects of data operations in the Calibo Accelerate platform.
To populate data in the DataOps tab, you must select the following options:
-
Portfolio
-
Product
-
Workstream
-
Pipeline
-
Timeline - select the period for which you want to populate the data.

Note:
If the timeline selected is after the pipeline creation date, the data in widgets like Pipelines or Summary like Pipelines Created will not be displayed.
After selecting the options, click Apply. The data is populated, based on the selected options.
The various widgets of the DataOps dashboard show the following information:
| Widget | Description |
|---|---|
| Records Processed |
This widget shows the total number of records processed per month for the selected pipeline during the specified timeline. |
| Summary |
The summary shows the high-level performance of the pipeline in terms of executions, failures, merges, while the widgets show detailed graphs over the selected timeline.
|
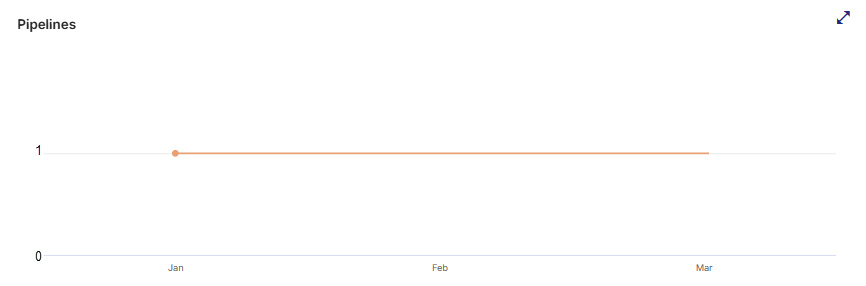
| Pipelines |
This widget shows the number of pipelines created during the selected timeline. When a pipeline is selected, if the creation date of the pipeline is within the selected timeline, it will show the data as 1. Else it will show No data to display. |
| Promotions |
This widget shows the total number of promotions done across the mentioned stages for the selected pipeline, during the selected timeline. |
| Executions and Failures |
This widget shows the total number of pipeline executions and failures for the selected workstream or feature over the selected timeline. |
| Merges |
This widget shows the number of code merges that were completed for the deployable technologies used in the pipelines of the selected workstream or feature over the selected timeline. |


| What's next? Maturity Assessment |