Overview Dashboard
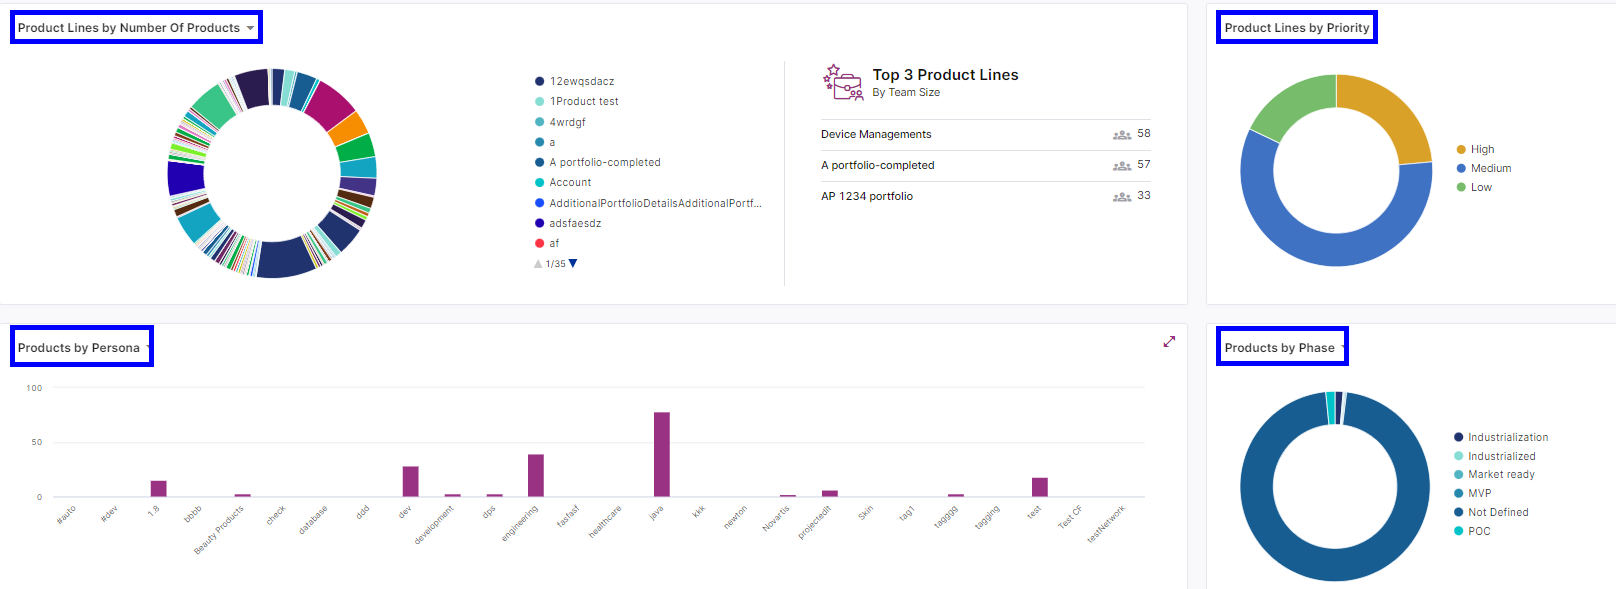
The Overview tab within the Dashboards workspace provide a summary of your product portfolios, making it ideal for executives, product teams and portfolio managers to quickly assess key metrics and details. Apart from KPIs for Product Portfolios, Products, Teams and Release Trains, it also provides information about Product Portfolios by Number of Products, Product Portfolios by Priority, Products by Phase and Products by Priority.
How do I view the Overview tab?
- Sign in to the Calibo Accelerate platform and navigate to Dashboards.
- On the Overview tab, you can view the following information:

| KPIs |
|
The widgets show the following information:

|
Product Portfolios by Number of Products |
|
|
Top 3 Product Portfolios by team size. |
Shows top 3 product portfolios that have the largest team size. |
| Product Portfolios by Priority |
Shows a donut chart of product Portfolios by the following priorities:
Click on the donut chart to view the list of products as per priority. Click on a product portfolio for a drill-down view. |
| Products by Tag | Displays a bar graph of products based on tags assigned to them.Hover over a bar to view the number of products associated with a tag. Click on a bar to access the list of products linked to that tag. |
| Feature by Tag (Click the arrow on Products by Tag and then click Feature by Tag ) | Shows a bar graph of features organized by tags. Hover over a bar to view the count of features associated with a tag. Click on a bar to drill down into the detailed list of features linked to that tag. |
| Products by Business Group (Click the arrow on Products by Tag and then click Products by Business Group ) | Shows a bar graph based on number of products associated with each business group. Click on a bar to view the list of products. Click on a product to view the product drill-down view. |
| Products by Customer Segment (Click the arrow on Products by Tag and then click Products by Customer ) | Shows bar graphs of products according to customers that they cater to. Click on a product to view the product drill-down view. |
| Products by Phase | Shows a donut chart of the phases in which various products are. Hover over a phase to view the number of products in the phase, click on the donut chart to view the list of products in the phase. Click on a product to view the product drill-down view. |
| Products by Priority (Click the arrow on Products by Phase and then click Products by Customer ) |
Shows a donut chart of product by the following priorities:
Click on the donut chart to view the list of products as per priority.Click on a product to view the product drill-down view. |
| What's next?Release Trains Dashboard |