Monitoring: Agile
The Agile tab of the Monitoring section provides visibility into the team performance across sprints during the development of a product or application. It provides insights about areas of improvement in sprints by providing detailed analysis. It shows data related to average sprint hit rate, sprint velocity, sprint burndown, scope change, sprint burnup, sprint duration and so on. The data seen in the widgets is fetched from the agile tool that you associate with the product. See Configure Agile Tool to Fetch Project Data into Calibo Accelerate Platform
The widgets of the Agile tab are as follows:
KPIs:
- Open issues - number of open issues during application development.
- Average release duration - the average duration of a release in days.
The various widgets provide the following information:
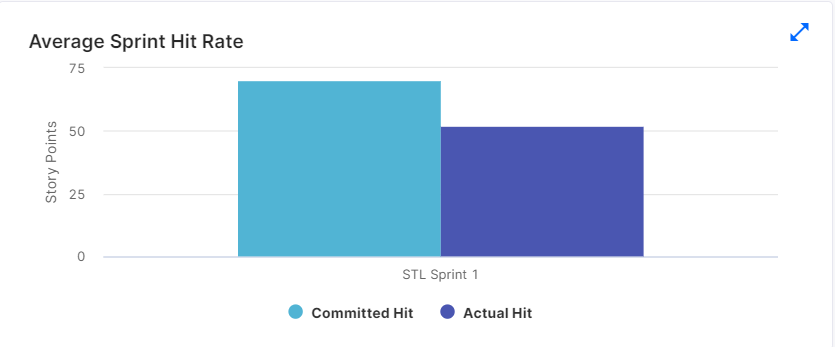
| Average Sprint Hit Rate shows in terms of story points the committed stories versus the actual stories that were completed. |
|
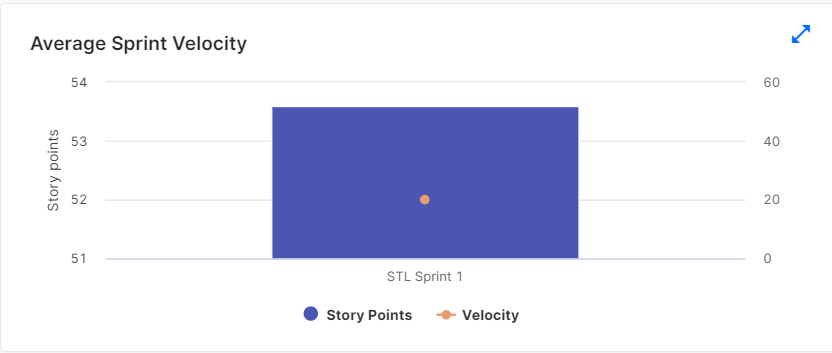
| Average Sprint Velocity shows the amount of work completed for the sprint in story points. |
|
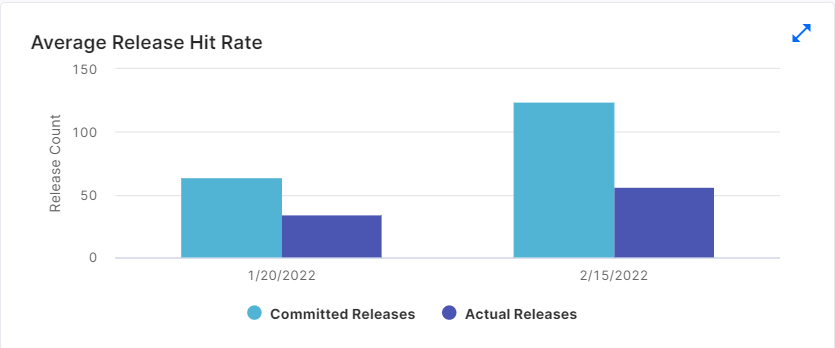
| Average Release Hit Rate shows the committed versus actual story points per release. |
|
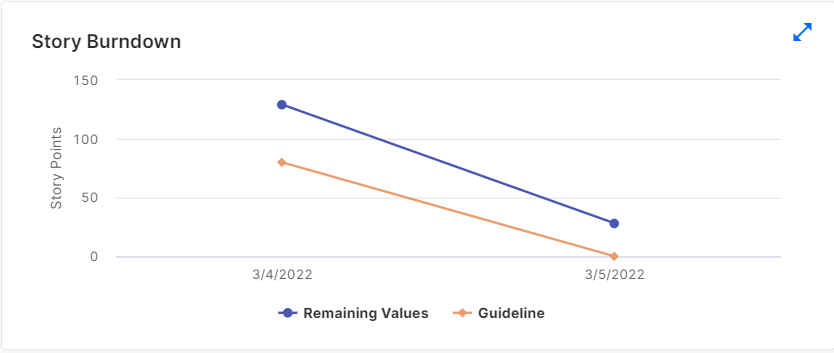
| Story Burndown - shows the story points to be completed against committed timeline. |
|
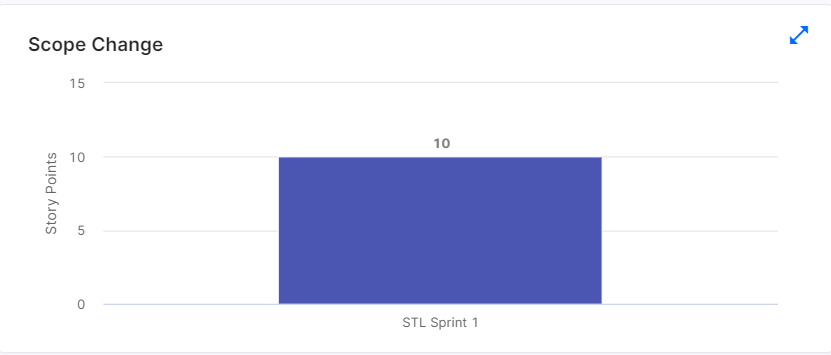
| Scope Change - shows the scope change in terms of story points for a sprint. |
|
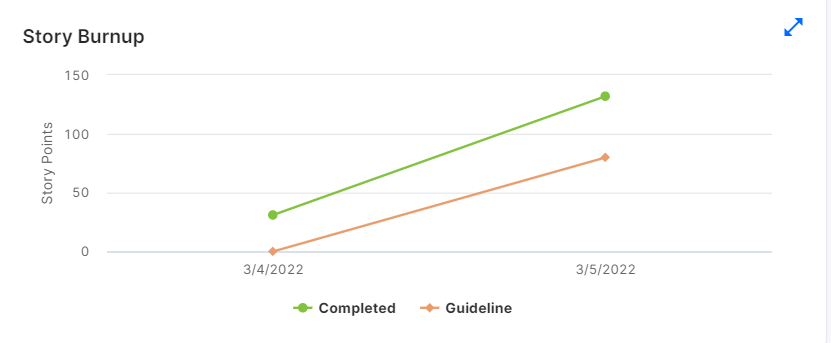
| Story Burnup - shows the story points completed against committed timeline. |
|
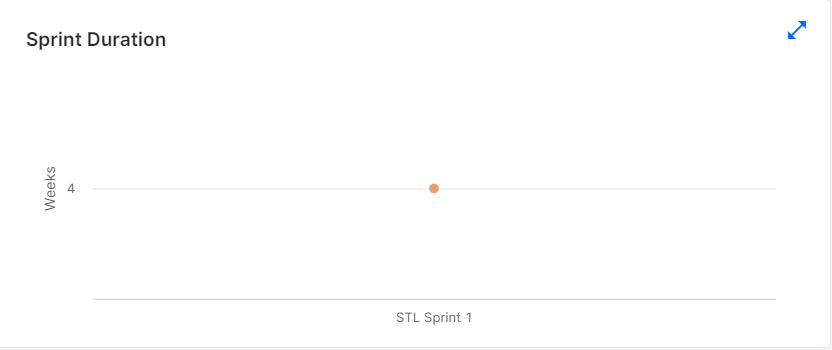
| Sprint Duration - The duration of the sprint in weeks. |
|
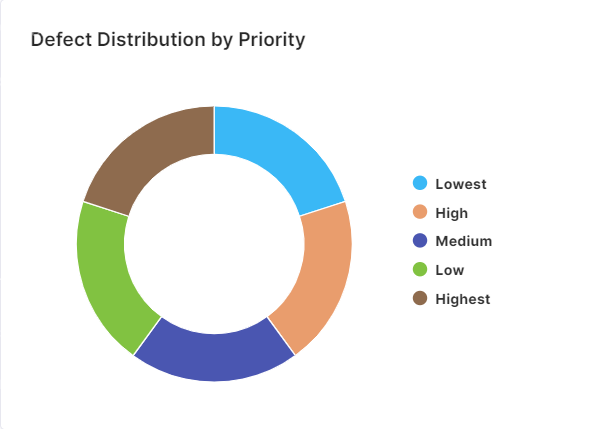
| Defect Distribution by Priority - shows the defect distribution according to priority - lowest, low, medium, high, highest. |
|
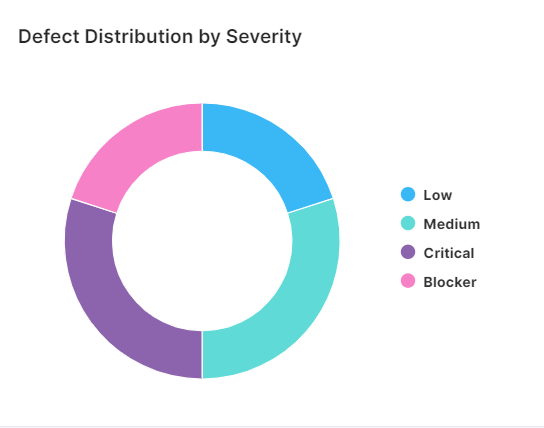
| Defect Distribution by Severity - shows the defect distribution according to severity - low, medium, critical, blocker. |
|
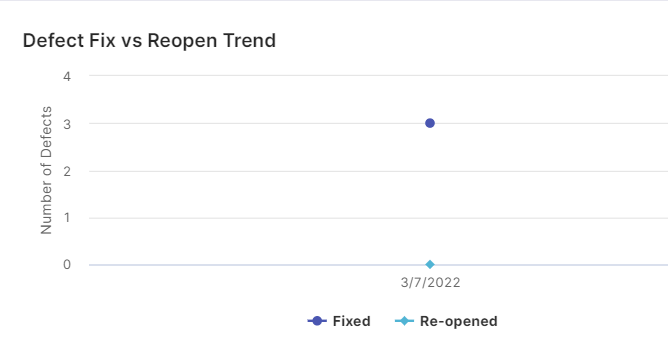
| Defect Fix vs Reopen Trend - shows the data of defects that are fixed versus the defects that were reopened for the specified timeline. |
|
|
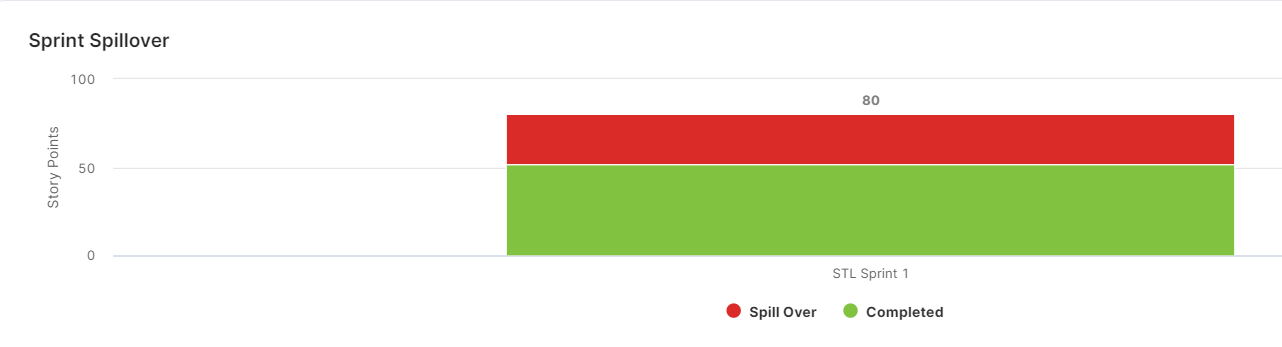
Sprint Spillover - shows the story points completed and story points that are spilled over across the selected sprint for the specified timeline. |
|
.
| What's next? Monitoring: Code Quality |