Teams Dashboard
The Teams tab of the dashboards workspace provides information about teams, members of teams, roles, and companies or vendors that provide resources or team members. It provides information about teams by size, resources by roles, resources by company, and resources by cost area.
Most widgets have a drop-down option for additional widgets with related information. If you select a particular widget from the drop-down, you can make it the default widget by clicking  Set this as the default widget. You can expand a widget by clicking
  .
.

The KPIs include the following:
- Teams - the total number of teams created in the Calibo Accelerate platform. Click the arrow to view the list of teams and search for a particular team.
- Members - the total number of members working on various products, this includes team members as well as individual members (that are not part of a team). Click the arrow to view the list of members and search for a specific member. Effective FTE shows the number of resources being utilized as full time employees. For example if two resources are working on this product at 50% capacity, the effective FTE for them is 1.
- Roles - the different roles that are assigned to team members and individual members. Click the arrow to view the list of roles and search for a specific role.
- Companies - the different companies from which resources are hired for various products.
The widgets include:
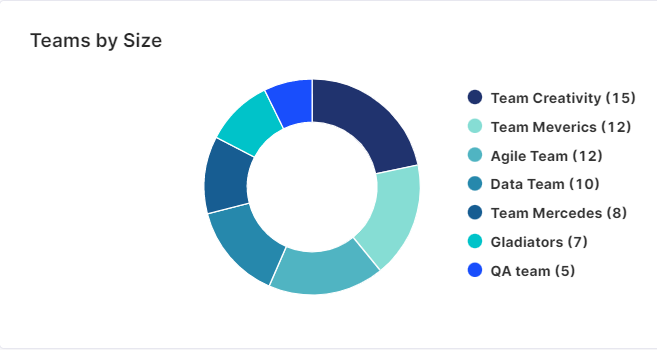
This widget provides information about teams by size or team members. Each section of the donut represents a team, hover over a section to view the team name and number of members. Click a section of the donut to view the list of members of a team, and search for a member.
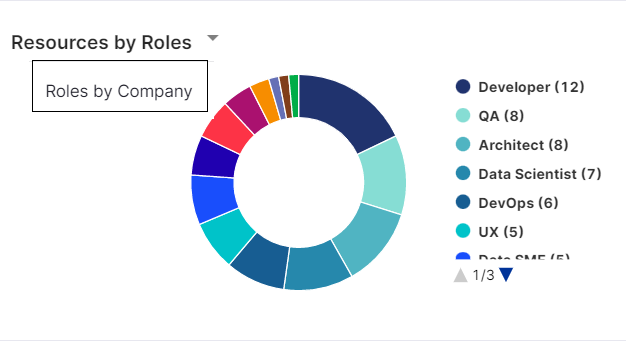
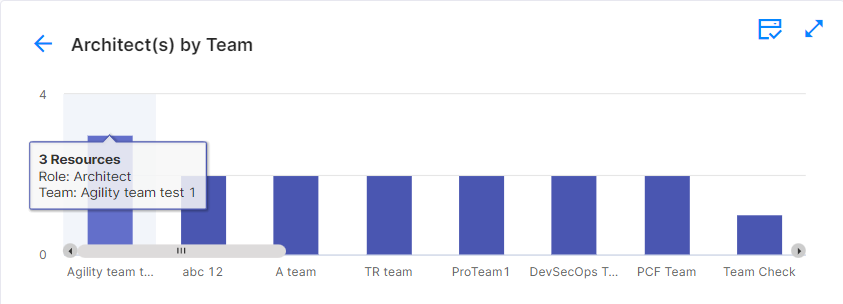
This widget provides information about the roles assigned to resources from different teams. Each section of the donut represents a type of role, hover over a section to view the role name and number of members of that role. Click a section to view a bar graph of that specific roles. The bar graph shows the distribution of resources with that role across teams. Hover over a bar to view details like of resources, role, and team. Click a bar to view the list of resources. You can search for a specific resource.
Click the arrow to view Roles by Company. This bar graph provides the number of roles assigned to resources by each vendor company.
|
|
This widget provides information about number of resources provided by each company. The widget also provides the following additional information:
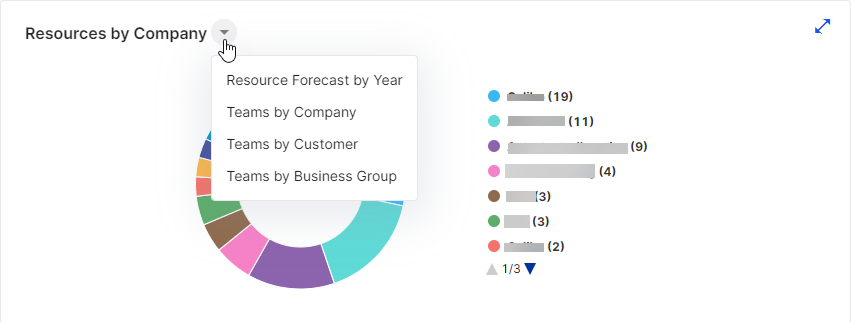
- Resource Forecast by Year - this widget shows the forecast of resource requirement per year. If you click the bar graph for a particular year, the monthly resource forecast is displayed.
- Teams by Company - this widget shows bar graphs for each company. Click a bar graph to view a list of teams that have resources provided by the company.
- Teams by Customer - this widget provides information about number of teams catering to each customer segment. Each bar graph represents a customer segment. Click the bar graph to view the list of teams, you can also search for a team.
- Teams by Business Group - this widget provides information about number of teams assigned to each business group. Each bar graph represents a business group. Click the bar graph to view the list of teams, you can search for a team.
The donut graph shows the share of each cost area, click on a section to view resources listed under each cost area. You can also search for a specific resource.
This widget also includes the following graphs:
- Resources by Company and Cost Area - the bar graph provides information related to companies and share of each cost area. Click on a cost area of the bar graph to view the list of resources for that cost area.
- Resources by Team Type - the donut graph shows resource by the teams that they are allocated to. You can click on a section of the donut to view a list fo team members of that team.
Each bar graph represents a role and is further divided by cost area, hover over a bar graph to view the break down of number of resources per cost area.
The widget also provides the following graph:
Resources by Skills and Location - each bar graph represents a skill and is further divided based on number of resources per location. Each section of the bar graph shows the number of resources of that skill for a location.
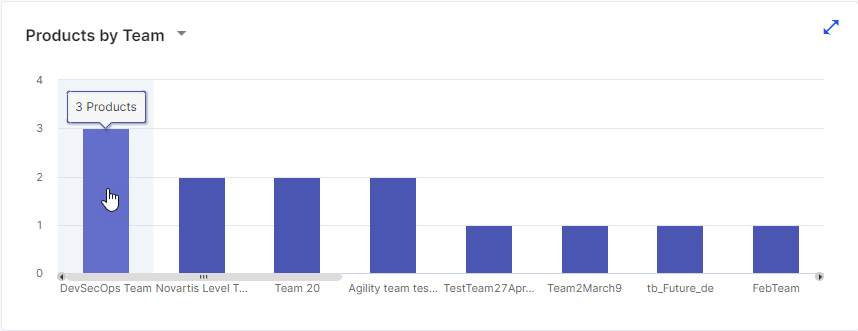
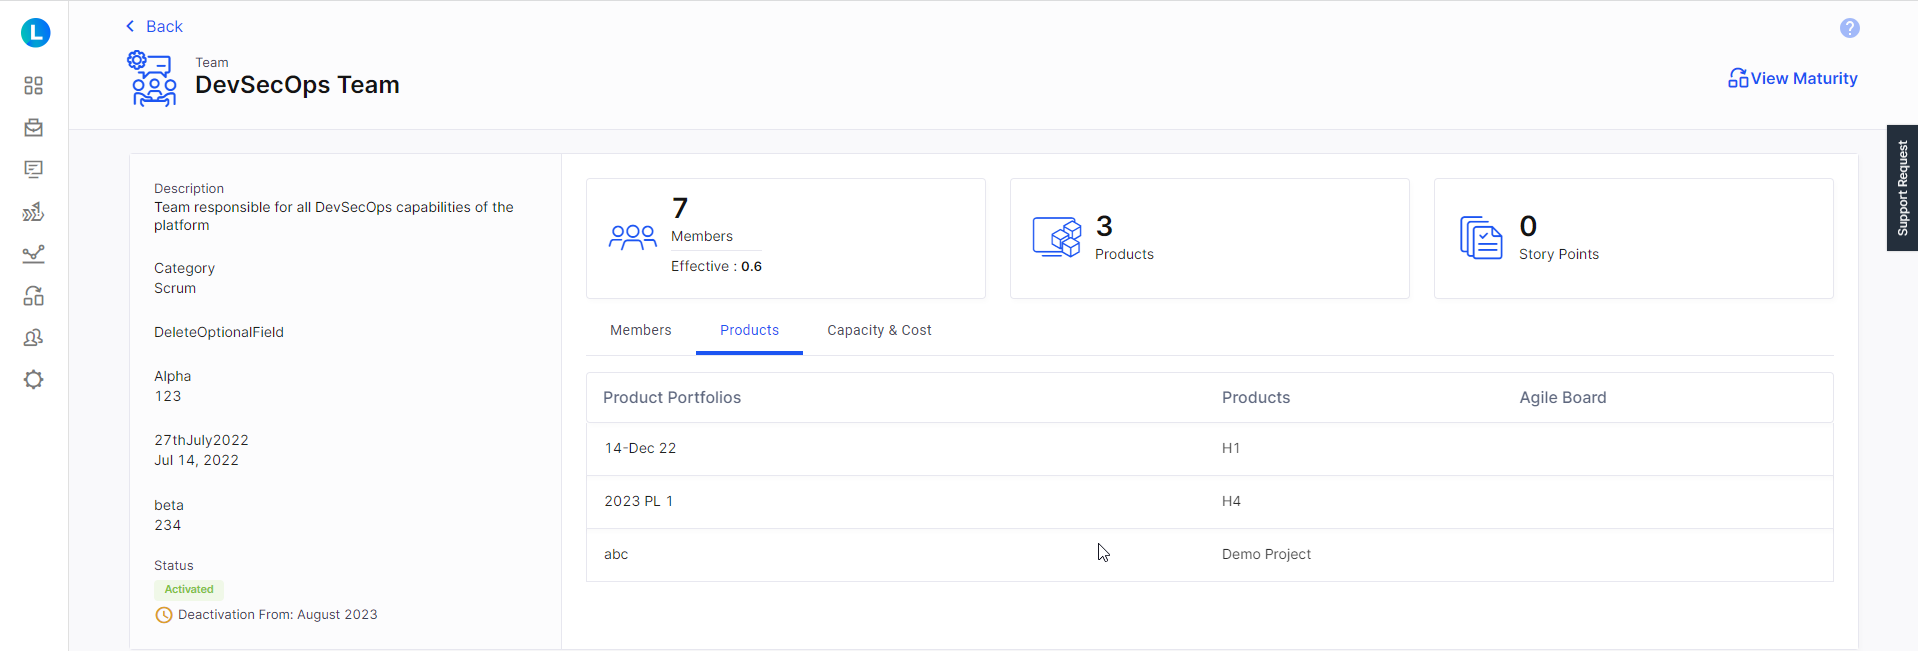
Each bar graph represents a team and on hover of the bar graph it shows number of products associated with the team. When you click a bar graph, it shows the details of that team.
|
|
The widget also provides the following graphs:
- Teams by Product Portfolio - this widget provides information related to various product portfolios. The following information is provided for each product portfolio
- number of products
- number of teams working on products
- number of members working on products.
- Teams by Products - each bar graph represents a product, when you click a bar graph you see a list of teams associated with the product.
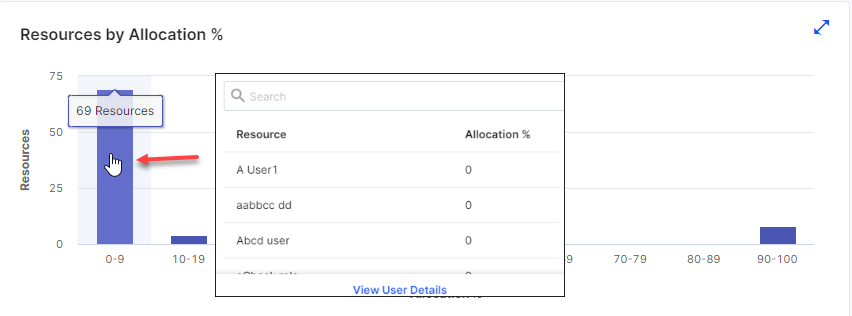
% capacity of the resources allocated to this team.
|
|
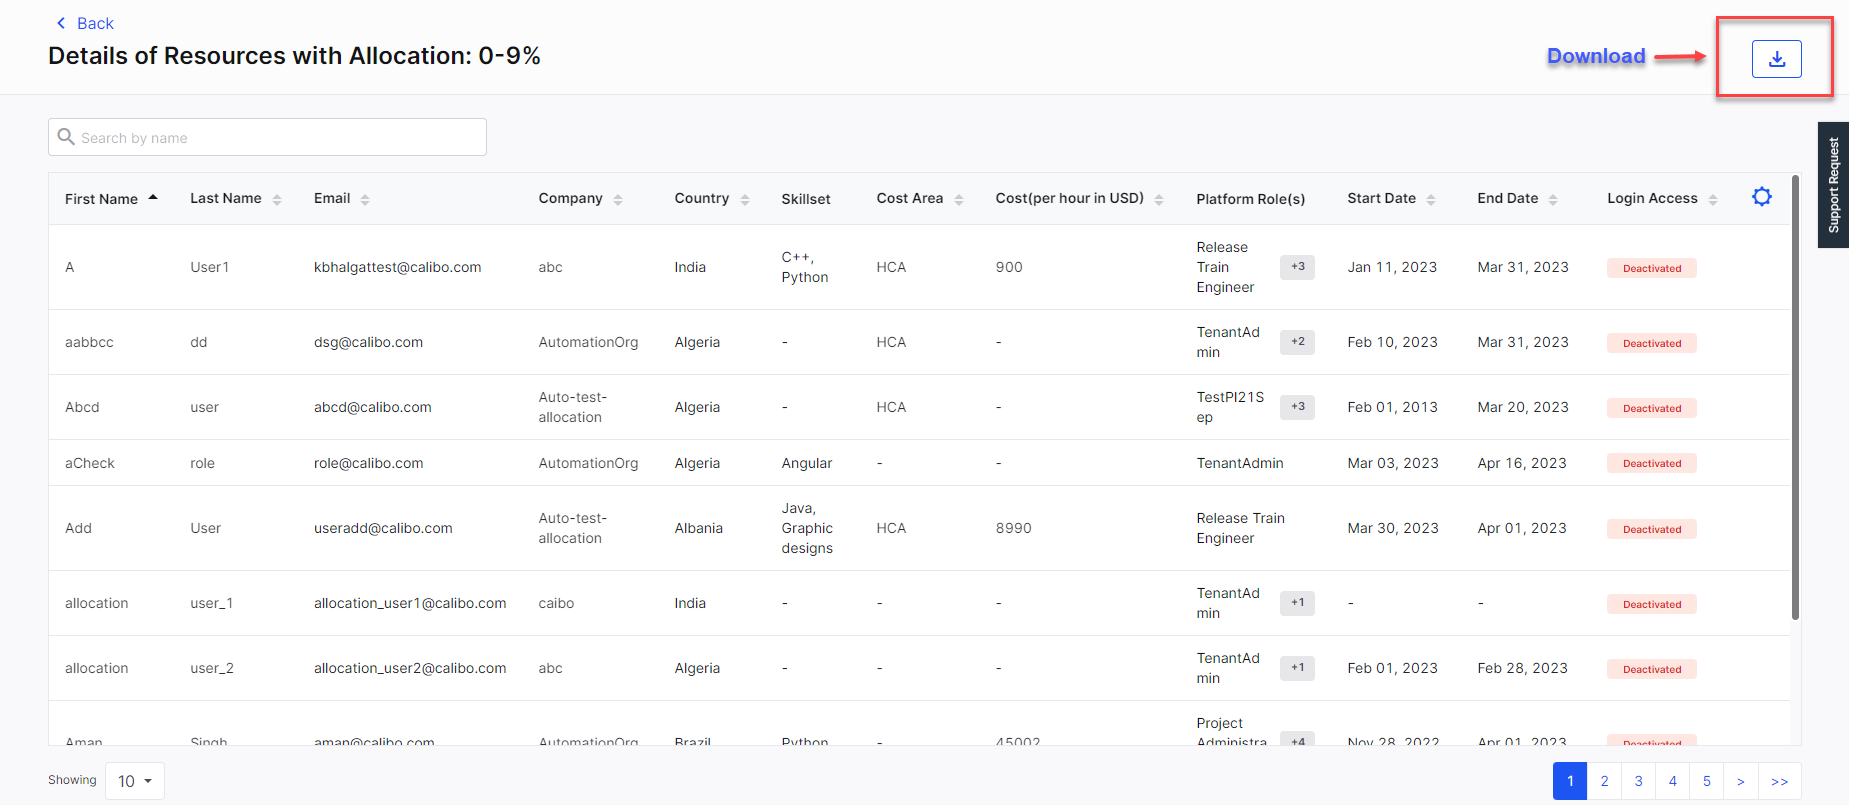
You can click the View User Details link. This navigates you to a screen where you can view the details of resources with 0-9% allocation. You can download this report for your reference.
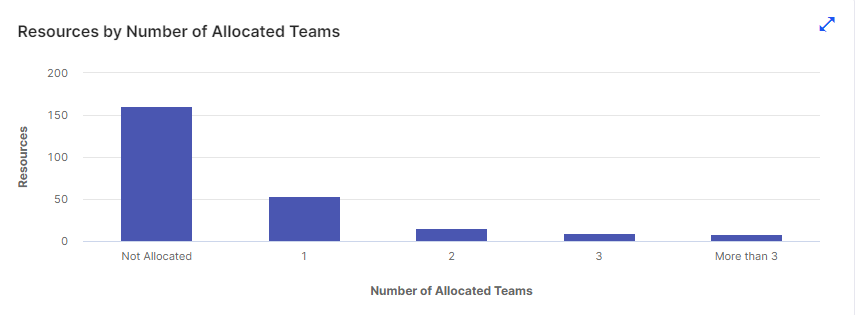
This widget provides information about how many resources are not allocated to any team, allocated to 1 team, allocated to 2 teams and so on. The information is displayed in the form of bar graphs. When you can click a bar graph and then click View User Details you can see a list of resources allocated to the selected number of teams.
|

|
This widget provides information about resources by the groups (in the organizational hierarchy) that they are associated with. The table provides information about the team associated with a group and the number of resources in each team.

This widget provides information about resources requested and allocated for each quarter. Each quarter consists of two bar graphs - one showing requested resources and the other showing allocated resources.

This widget provides information about the overall trend of full time employees in terms of availability and utilization. The information is available for a total of 5 years - the current year, past 2 years and 2 years in the future.

| What's next? Business Requirements Dashboard |