Manage Deployment on a Docker Container
When configuring the deployment details in a deployment stage, if you select the Docker deployment mode, the Docker Container section is active on the Deployment tab within that stage. The cloud accounts that you select during stage configuration are listed in the Docker Container section.

To manage your deployments on a Docker container, do the following:
Configure a Cloud Instance
-
On the Deployment tab, in the Docker Container section, all the cloud accounts configured for your deployment stage are displayed.
Each cloud account card represents a configured cloud account. From each card, you can add instances to deploy your technologies to that specific account.
Click +Add Instance and choose a machine configuration option that suits your deployment requirements.

One or more of the following options are available depending on the platform configuration enabled by your administrator.
-
Large - 8GB RAM 2vCPU
-
Medium- 4GB RAM 2vCPU
-
Small- 2GB RAM 2vCPU
-
Custom configuration
Select the appropriate configuration option for your cloud server instance.


Note:
If your desired instance configuration option is not available in the list, contact your platform administrator.
-
-
Click Configure to define the cloud account and network settings.

-
In the Cloud Account and Network Settings side drawer, your chosen instance type, memory, and CPU configuration are displayed at the top. Review the instance configuration and then do the following:
Field Action / Description Name Provide a logical name for your instance. Hard Disk Size Select the desired hard disk size from the list. The disk size determines how much space is available for your container images, logs, and application data. For Docker deployments, 20 GB is the recommended minimum size. Increase the size if your applications handle large data volumes or generate heavy logs. Cloud Account The cloud account on which you configure a cloud instance is auto-populated. Use Public or Private Subnet Enable the Use Public Subnet toggle to launch the instance in a public subnet. Then, select a Public Subnet from the dropdown.
Otherwise, select a Private Subnet from the dropdown to deploy the instance within a private network.
Security Groups Select one or more security groups. They act as virtual firewalls controlling inbound and outbound traffic for instances hosting your Docker containers. Application Security Groups (Optional) If you configure settings for an Azure instance, select one or more application security groups. This field is optional. AMI ID (Optional) Select the unique ID of the Amazon Machine Image (AMI) that you want to launch. -
Click Save to create the instance and apply the specified cloud and network settings.

Create Load Balancer Manually
If, while creating or editing a stage, you choose to manually create a load balancer for your Docker deployment, you must configure the load balancer to complete your technology deployment.
Click Configure Load Balancer.
In the Configure Load Balancer side drawer, complete the steps mentioned on the UI, get the DNS name of your load balancer, and provide it in the DNS Name field.

View Technologies Pending for Deployment
In the Docker Container section, in the upper left corner, the list of ready-to-deploy technologies that you have added in the Develop phase is displayed. You can search for your desired technology in the list by the technology name or its title that you give while adding it in the Develop phase.

Add Technologies for Deployment
After you define the cloud account and network settings for your cloud server instance, you can add and configure the technologies you want to deploy within the Docker containers on the configured cloud instance. Do the following:
-
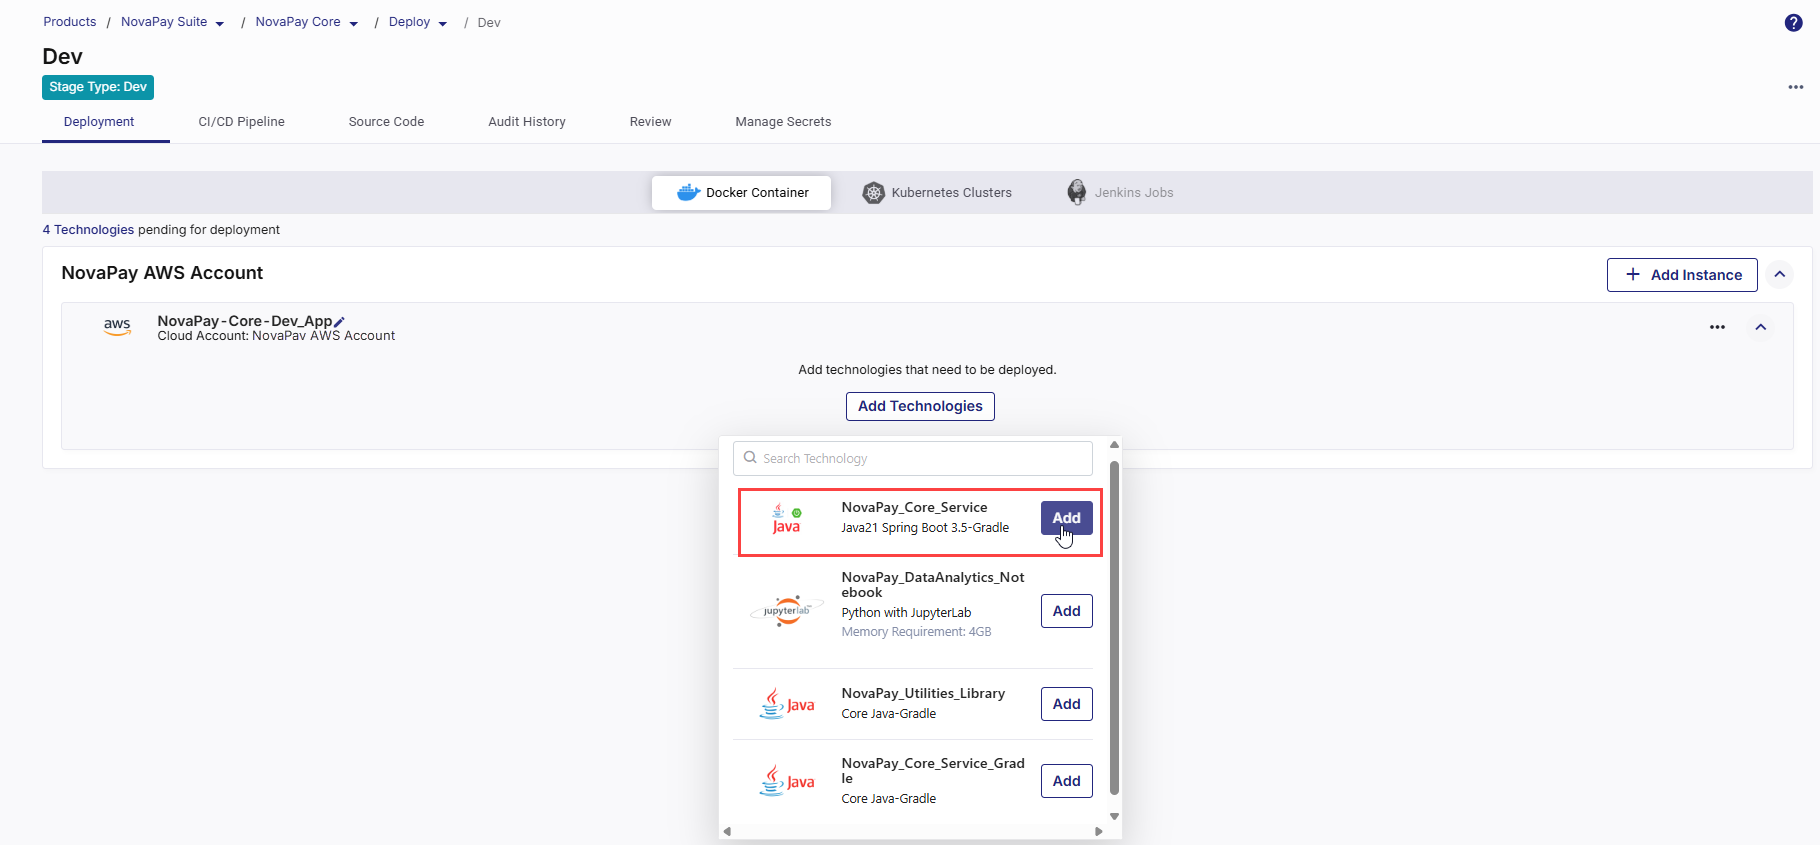
Click Add Technologies. The list of ready-to-deploy technologies that you have added in the Develop phase is displayed. You can search for your desired technology by the technology name or its title that you give while adding it in the Develop phase.
-
To add a technology for deployment, click Add next to the desired technology .
-
In the side drawer, configure the following details required for the deployment. These settings ensure your application is packaged, built, and deployed correctly within the selected cloud account.
Depending on the CI/CD tool selected in your deployment stage configuration, some configuration options and the overall flow will vary. The following sections describe the configuration process separately for Jenkins and GitHub Actions.
 If Jenkins Is Your CI/CD Tool
1. Specify Context Path
If Jenkins Is Your CI/CD Tool
1. Specify Context Path
In the Context Path field, specify the context path for your application. The context path defines the URL segment through which users can access your containerized application once deployed.
For example, if you set the context path to "
/banking-service", users will access your application at "https://yourdomain.com/banking-service".Use a short, meaningful path name that reflects the application or service being deployed.
2. Configure Continuous Integration (CI) Settings
Continuous Integration automates the process of building, testing, and preparing your application whenever code changes occur or based on a defined schedule.
-
Source Code Branch
Select the specific branch from your source code repository that contains the code you want to deploy. Your CI pipeline will monitor this branch for changes.
-
Trigger Types
The CI trigger determines when the pipeline should start:
-
Code Change – The pipeline runs automatically whenever changes are committed to the selected branch. Ideal for active development workflows.
-
Manual – The pipeline is triggered only when you explicitly start it from the platform. Suitable for controlled build scenarios.
-
Schedule – You can define one or more time-based schedules to run the CI pipeline automatically at specific times. Useful for periodic deployments and testing.
In each schedule, you can specify the following:
-
Time Zone: Select the desired time zone for the CI trigger schedule.
-
Frequency : Select the Every Day or Every Week option as required.
-
Time: Define when to trigger the pipeline (in hours and minutes). You can define multiple schedules as well.
Best Practice:
-
Use Code Change in development to get instant feedback on commits.
-
Use Manual in production to avoid unintentional deployments.
-
Use Schedule for batch updates or automated maintenance windows.
-
-
3. Configure Continuous Deployment (CD) Settings
Continuous Deployment defines how and when your built image is deployed as a running container.
-
Port Number
Enter the port number on which your application will be exposed. It is important to ensure that the specified port is open and available for successful communication.
-
Trigger Types
The CD pipeline trigger determines when the container deployment starts after the build completes.
-
Run after Continuous Integration – Automatically deploys the container immediately after a successful CI run. Ideal for lower environments like Dev or QA to enable continuous delivery.
-
Manual – Deploys only when triggered manually from Calibo Accelerate. Recommended for production or controlled release environments.
-
Schedule – You can define one or more time-based schedules to run the CD pipeline automatically at specific times. Useful for periodic deployments and testing.
In each schedule, you can specify the following:
-
Time Zone: Select the desired time zone for the CD trigger schedule.
-
Frequency : Select the Every Day or Every Week option as required.
-
Time: Define when to trigger the pipeline (in hours and minutes). You can define multiple schedules as well.
-
-
Note:
The Run after Continuous Integration and Schedule triggers become active only after the technology has been deployed manually at least once from Calibo Accelerate.
This ensures that the required Docker infrastructure, network settings, and instance configurations are properly initialized before automated deployments begin.
 4. Functional Testing (Optional)
Enable Functional Testing if you want to perform end-to-end automation testing after the container is deployed.
-
Testing Tool: Choose your preferred functional testing tool from the list. Currently, the Calibo Accelerate platform supports the following testing tools:
-
Selenium
-
Cypress
-
-
Browser: This field is available if you select Cypress as a testing tool. Select the web browser in which you want to run your Cypress tests.
-
Test Case Repository: Specify the URL of the repository where your test cases are stored. For example,
https://github.com/your-username/your-cypress-repo.git -
Test Case Repository Branch: Select the branch within the test case repository where your desired test cases are located.
-
Test Case Command: Enter the command to execute the test suite.
If GitHub Actions Is Your CI/CD Tool
1. Specify Context Path
In the Context Path field, specify the context path for your application. The context path defines the URL segment through which users can access your containerized application once deployed.
For example, if you set the context path to "
/banking-service", users will access your application at "https://yourdomain.com/banking-service".Use a short, meaningful path name that reflects the application or service being deployed.
2. Add Runner Labels
-
What are runners in GitHub Actions?
In GitHub Actions, a runner is a server that executes the jobs defined in your workflow. Each runner listens for available jobs, runs them when triggered, and reports the results back to GitHub. There are two main types of runners:GitHub-hosted runners – Managed by GitHub, automatically updated, and preconfigured with popular tools and languages.
Self-hosted runners – Managed by you, allowing custom hardware, software, and network configurations.
-
What are runner labels?
Runner labels are tags or identifiers assigned to self-hosted runners to categorize them based on their characteristics, capabilities, or intended use. When you specify runner labels in your deployment configuration, the job will be assigned only to runners that match all the specified labels.
-
Specify all intended runner labels
Specify one or more runner labels to ensure that the GitHub Actions workflow is assigned to an appropriate runner.
The workflow job is assigned to a runner whose label set matches all specified labels. If no matching runner is available, the job remains in a pending state until one becomes available.
Tip:
Maintain a documented list of available runner labels in your project so developers know which labels to use.
3. Configure Continuous Integration (CI) Settings
Continuous Integration automates the process of building, testing, and preparing your application whenever code changes occur or based on a defined schedule.
-
Source Code Branch
Select the specific branch from your source code repository that contains the code you want to deploy. Your CI pipeline will monitor this branch for changes.
-
Trigger Types
You can define one or more Continuous Integration (CI) triggers to automate when your pipeline should run. By default, the Manual trigger is always present and cannot be deleted. You can add additional triggers — After Push and/or Cron Schedule — based on how you want to automate the CI workflow.
-
Default Manual Trigger – The pipeline is triggered when you explicitly start it from the platform. This trigger is preselected and you cannot delete it. This ensures there is always at least one valid trigger method for the pipeline. Suitable for controlled build scenarios.
-
Adding a New Trigger
Click + New Trigger to define when and how your CI pipeline should be initiated automatically. From the list of available trigger types, select your desired trigger type.
-
After Push – The pipeline runs automatically whenever changes are committed to the selected source code branch. Ideal for active development cycles where continuous integration must occur after every update.
To add this trigger, select After Push for the list of available triggers, and then click Add.
-
Schedule – You can define one or more time-based schedules (cron expression) to run the CI pipeline automatically at specific times. Useful for nightly builds, periodic testing, or maintenance runs.
In each schedule, you can specify the following:
-
Time Zone: Select the desired time zone for the CI trigger schedule.
-
Frequency : Select the Every Day or Every Week option as required.
-
Time: Define when to trigger the pipeline (in hours and minutes).
Click Add.
You can define multiple schedules as well. To add another schedule, in the Cron Schedule section, click +Schedule and to define the schedule, repeat the steps mentioned earlier.
Best Practice:
-
Use Manual in production to avoid unintentional deployments.
-
Use Code Change in development to get instant feedback on commits.
-
Use Schedule for batch updates or automated maintenance windows.

-
-
-
4. Snyk Configuration
The section is visible only when Snyk is selected as the Container Image Scanning Tool in the stage configuration.
By specifying the appropriate Snyk project and severity level, you can enforce security gates that cause the CI pipeline to fail when vulnerabilities exceed the allowed risk threshold, preventing insecure container images from being promoted further in the delivery workflow.
Use the following settings to create a Snyk project from within Calibo Accelerate and define the vulnerability severity thresholds that act as security gates for the CI pipeline.
Project:
Provide a unique name for the Snyk project that will be created for this technology. Calibo Accelerate creates a separate Snyk project with this name to independently manage and track scan results for this technology in your Snyk dashboard.
If the project name already exists, or if the configured Snyk API token is invalid or expired, project creation fails and an appropriate validation or authentication error is displayed. In this case, contact your Calibo Accelerate administrator for assistance.
Severity:
Select the vulnerability severity level from the drop-down that will trigger CI pipeline failure:
-
Critical: The pipeline fails only when critical vulnerabilities are detected.
-
High: The pipeline fails when high and/or critical vulnerabilities are detected.
-
Medium: The pipeline fails when medium, high, and/or critical vulnerabilities are detected.
-
Low: The pipeline fails when any vulnerabilities, including low-severity issues, are detected.
-
None: Bypasses severity checks and allows the pipeline to continue regardless of detected vulnerabilities. Use this option when you want to collect information regarding vulnerabilities without blocking the deployment process.
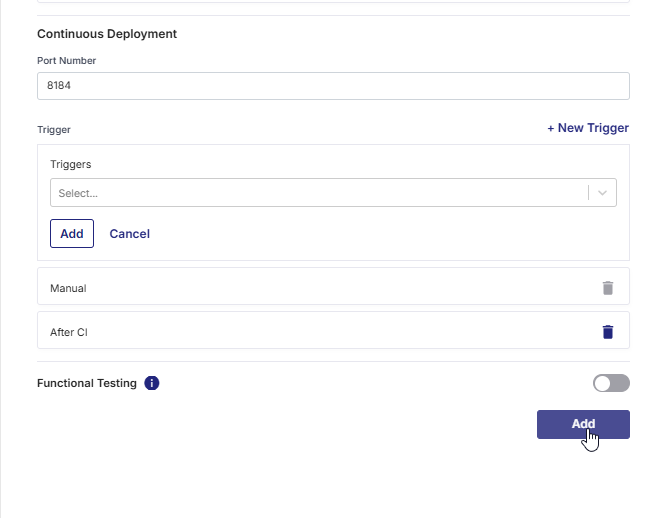
5. Configure Continuous Deployment (CD) Settings
Continuous Deployment defines how and when your built image is deployed as a running container.
-
Port Number
Enter the port number on which your application will be exposed. It is important to ensure that the specified port is open and available for successful communication.
-
Trigger Types
After configuring the Continuous Integration (CI) section for a technology deployed on a Docker container, you can define one or more Continuous Deployment (CD) triggers to control when deployment should occur. By default, the Manual trigger is always present and cannot be deleted, ensuring that deployment can always be executed manually if automated triggers are not configured.
-
Default Manual Trigger – Deployment happens only when triggered manually from Calibo Accelerate. This trigger is preselected and you cannot delete it. Recommended for production or controlled release environments.
-
Adding a New Trigger
Click + New Trigger to define when and how your CD pipeline should be initiated automatically. From the list of available trigger types, select your desired trigger type.
-
After CI – Automatically deploys the container immediately after the associated CI pipeline completes successfully. Ideal for continuous delivery workflows where deployment should immediately follow a successful build and test phase.
-
Cron Schedule – You can define one or more time-based schedules to run the CD pipeline automatically at specific times. Commonly used for scheduled releases, periodic environment refreshes, or maintenance deployments.
In each schedule, you can specify the following:
-
Time Zone: Select the desired time zone for the CD trigger schedule.
-
Frequency : Select the Every Day or Every Week option as required.
-
Time: Define when to trigger the pipeline (in hours and minutes). You can define multiple schedules as well.
Click Add.
You can define multiple schedules as well. To add another schedule, in the Cron Schedule section, click +Schedule and to define the schedule, repeat the steps mentioned earlier.
-
-
-
5. Functional Testing (Optional)
Enable Functional Testing if you want to perform end-to-end automation testing after the container is deployed.
-
Testing Tool: Choose your preferred functional testing tool from the list. Currently, the Calibo Accelerate platform supports the following testing tools:
-
Selenium
-
Cypress
-
-
Browser: This field is available if you select Cypress as a testing tool. Select the web browser in which you want to run your Cypress tests.
-
Test Case Repository: Specify the URL of the repository where your test cases are stored. For example,
https://github.com/your-username/your-cypress-repo.git -
Test Case Repository Branch: Select the branch within the test case repository where your desired test cases are located.
-
Test Case Command: Enter the command to execute the test suite.
-
- Click Add to save the details.
The technology is added for deployment to your configured cloud instance.
At this point, you can edit the deployment configuration details for your technology.

In the upper right corner, click Deploy. The list of all your configured and ready-to-deploy technologies is displayed in a side drawer. Select the desired ones, and then click Deploy.
The time to deploy each technology may vary depending on the technology complexity, size of the application, dependencies, and many other factors related to the deployment environment and network conditions. -
In the upper right corner, click Refresh to view the latest status of your technology deployments.
To fetch the real-time status of your technology deployments from the Jenkins server, click Force Refresh.
- As soon as you initiate technology deployment, an instance is created in your cloud account based on your specified configuration. On the Docker Container tab, the instance tile is the visual representation of that cloud instance. In the upper right corner of the instance tile, you can do the following:
-
Monitor the status of your cloud instance.
-
Add more technologies for deployment
-
Click the ellipsis (...) to do the following:
-
Stop a running instance
-
Remove instance from the cloud account
Note:
To delete an instance from your cloud account, first you must uninstall all the technologies deployed on the cloud instance.
- View or edit instance configuration
-
Deploy Technologies to Docker Container
Depending on the CI/CD tool selected in your deployment stage configuration, some steps in the technology deployment flow vary. The following sections describe the steps separately for Jenkins and GitHub Actions.
After a technology is added for deployment to your selected cloud account, do the following:
-
On the technology card, click the ellipsis (...).
-
Click Run CI Pipeline.
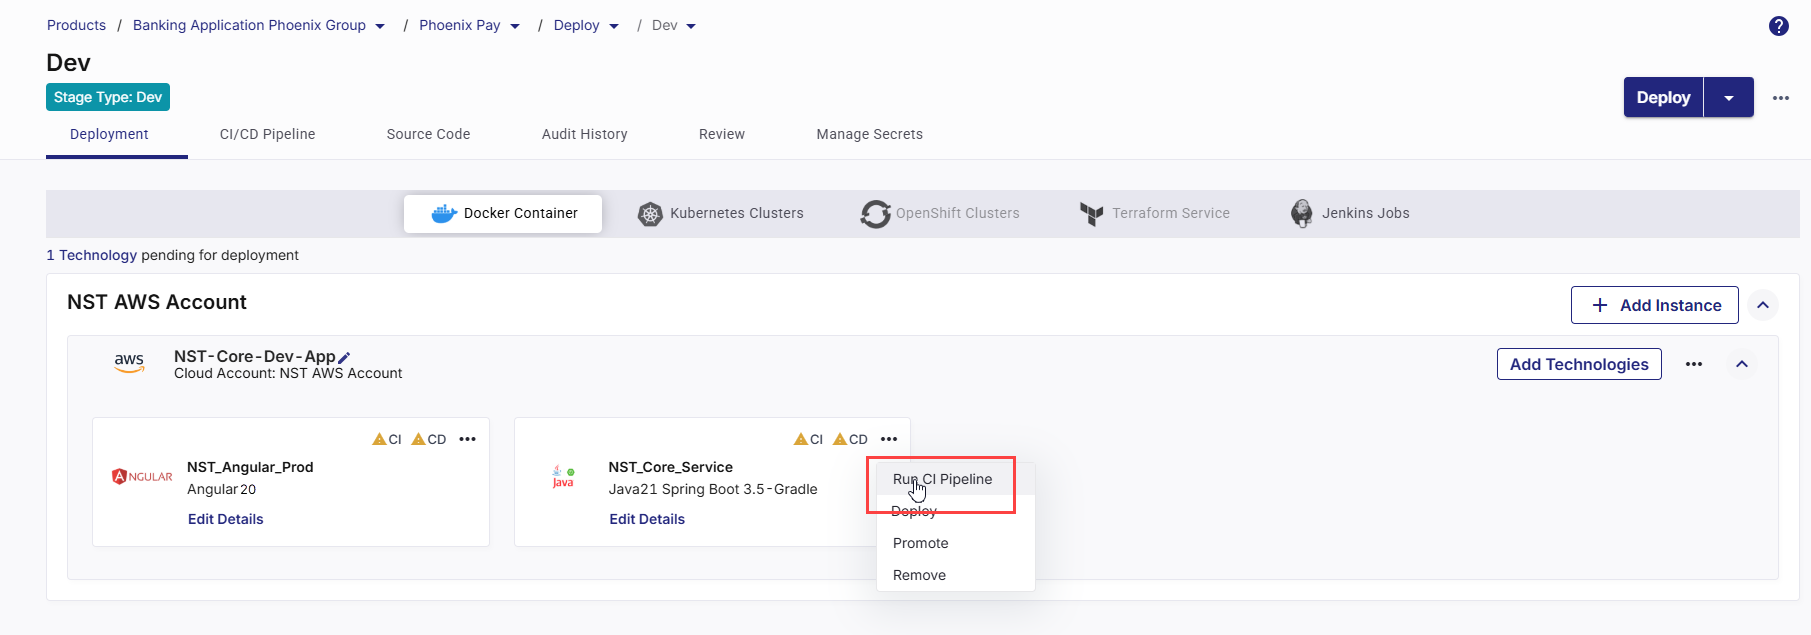
After the CI pipeline starts, the CI status changes to CI pipeline in progress.
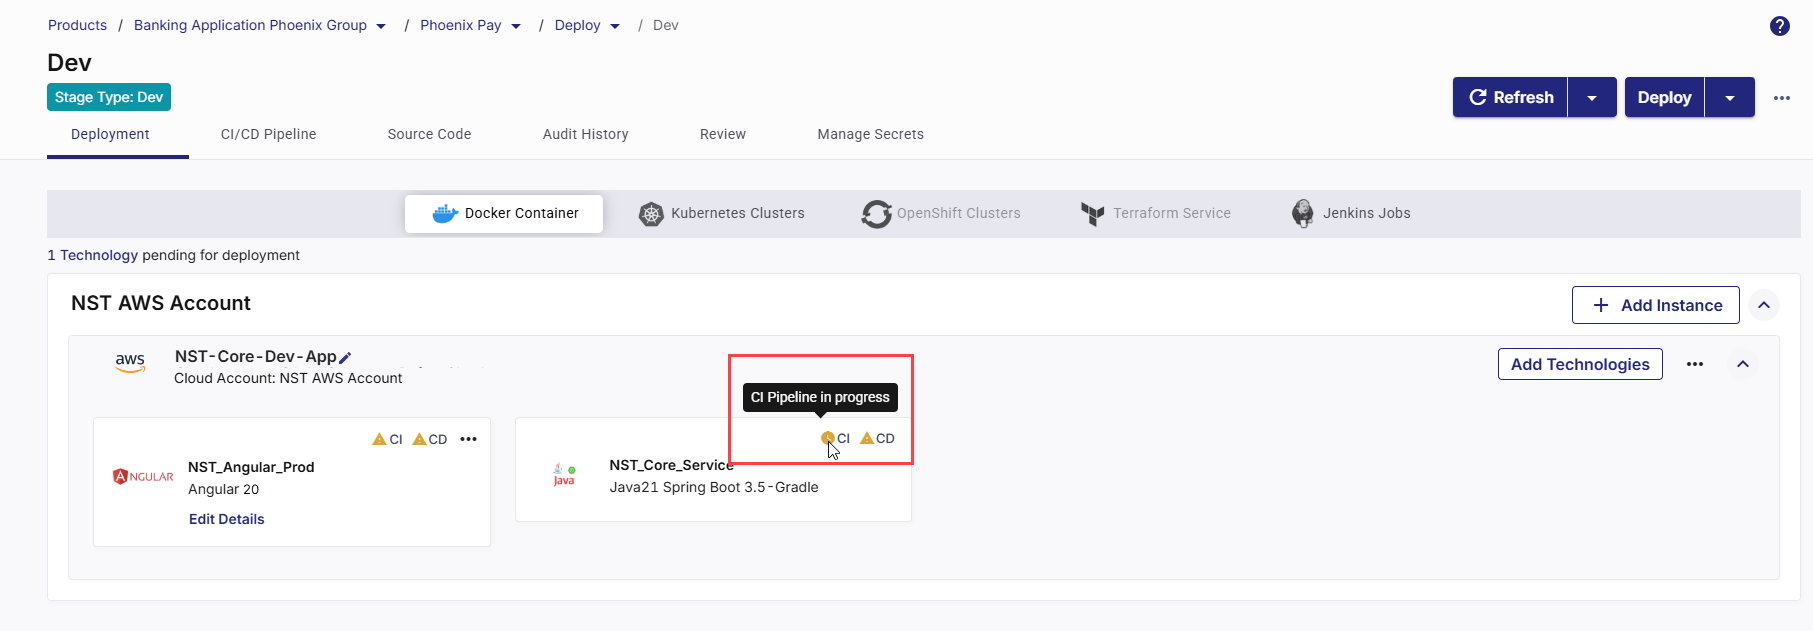
-
Click Refresh in the top right to update the status.
-
After the pipeline completes, the CI status changes to CI pipeline success.
-
To check real-time progress of your CI pipeline,
Go to the CI/CD Pipeline tab.

In the Continuous Integration (CI) pipeline for the technology being deployed, review each step:
-
Checkout SCM – Pulls source code from the configured repository.
-
Initialization – Prepares environment and sets up dependencies.
-
Build – Compiles and packages the application.
-
Unit Tests – Runs automated tests to validate code quality.
-
SonarQube Scan – Performs static code analysis for code quality and security.
-
Build Container Image – Creates a Docker image of the application.
-
Publish Container Image – Pushes the built image to the configured container registry.
-
After CI is successful, you can deploy the technology to the container.
-
On the technology card, click the ellipsis (...).
-
Click Deploy.

-
In the Deploy side drawer:
-
In the Container Image Tag list, choose the tag you want to deploy (for example, latest or a version number).

-
Click Deploy.

The Continuous Deployment (CD) status updates in real time to indicate progress through each deployment phase. The status transitions occur in the following sequence:
Status Description Instance provisioning in progress The required cloud instance is being created. After provisioning completes, the instance status is displayed as Running in the upper-right corner of the cloud instance card. Registering instance with load balancer The newly provisioned instance is registered with the configured load balancer to ensure proper traffic routing. Pipeline creation in progress The deployment pipeline is being initialized based on the configuration defined for this deployment. Pipeline build in progress The Docker image is being deployed as part of the automated deployment pipeline execution. Deployed The deployment is complete, and the Docker container is successfully running on the target instance.
-
- Click Refresh in the top right to update the status.
-
Click View Details on the technology card to check the following:
-
Basic Details

-
Instance name with memory and CPU configuration
-
Context path from deployment configuration
-
Links to:
-
CI Pipeline (Jenkins job run)
-
CD Pipeline (Jenkins deployment run)
-
Artifactory (JFrog or ECR image repository)
-
-
Live Application – Click Browse to open the deployed application.
-
-
Continuous Integration Tab
-
Displays the selected Source Code Branch
-
Shows the Pipeline Trigger (Manual, Code Change, or Schedule)

-
-
Continuous Deployment Tab
Shows the following details configured in the deployment configuration:
-
Host Port Number (The external port on the host system mapped to your container port.)
-
Port Number (The internal port on which your application runs inside the container.)
-
Pipeline Trigger

-
-
-
To check real-time progress of your CD pipeline, go to the CI/CD Pipeline tab. The following stages are displayed in the CD pipeline:
-
Declarative: Checkout SCM – Retrieves the latest source code from the repository.
-
Initialization – Prepares the deployment environment and required settings.
-
Deploy – Deploys the built Docker image to the container.
-
After a technology is added for deployment to your selected cloud account, do the following:
1. Missing YAML Workflow Files Are Identified
As soon as you add a technology for Docker deployment, Calibo Accelerate automatically detects the required GitHub Actions workflow files needed to enable the CI/CD pipeline. The platform displays a prompt asking you to review and commit these files to the linked GitHub repository. Click Create Pipeline to generate and commit the workflow files to the selected branch, ensuring that the CI/CD pipeline for the technology is properly set up and ready for execution.

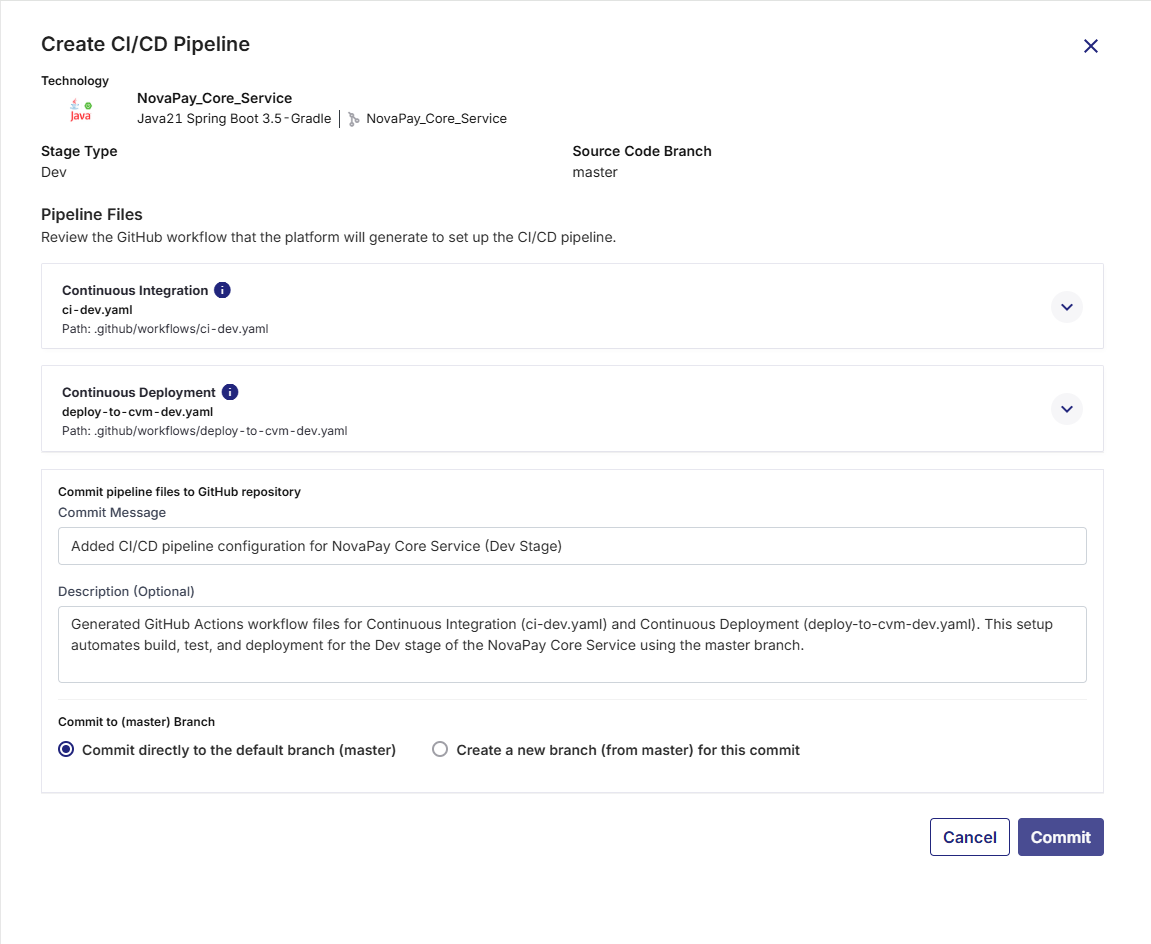
2. Review Pipeline Files
On the Create CI/CD Pipeline screen, the required GitHub Actions workflow files that must be committed to your GitHub repository are listed for your review. Depending on the technology being deployed, these files vary.
For example, for Java 21 Spring Boot 3.5- Gradle, the following files are required.
-
Continuous Integration (
ci-dev.yaml) – Handles building the application, running unit tests, performing static code analysis, and preparing artifacts. -
Continuous Deployment (
deploy-to-cvm-dev.yaml) – Handles deployments of Docker container images to configured virtual machines (VMs), supporting deploy, promote, rollback, and destroy actions, along with optional functional testing and artifact promotion.
For Python with JupyterLab, in addition to the ci-dev.yaml and deploy-to-cvm-dev.yaml files, the following YAML files are required:

-
Environment Setup (
setup-jupyterlab.yaml) – Defines the software environment, dependencies, and configurations required to run JupyterLab workflows within GitHub Actions. -
Add Algorithm (
clone-repo.yaml) – Clones and integrates a new algorithm repository into the JupyterLab pipeline. -
Run Algorithm (
run-ml-algo.yaml) – Orchestrates the execution of one or more machine learning or data analytics algorithms within the pipeline. -
Restart JupyterLab (
restart-jupyterlab.yaml) – Automates restarting the JupyterLab environment to apply new configurations or updates during the workflow execution. -
Continuous Integration (
ci-dev.yaml) – Handles building the application, running unit tests, performing static code analysis, and preparing artifacts. -
Continuous Deployment (
deploy-to-cvm-dev.yaml) – Manages deployment of the application to the configured Docker container environment.
Click each file’s expand icon ![]() to preview its full YAML content.
to preview its full YAML content.

3. Commit the Workflow Files to GitHub Repository
Once you have reviewed the CI/CD workflow files (for both Continuous Integration and Continuous Deployment), you must commit them to your GitHub repository so that they can be executed by GitHub Actions. Committing these files will place them under the .github/workflows/ directory in your repository, making them available for Calibo Accelerate to trigger pipeline runs. Do the following:
-
Commit Message: Provide a short, clear summary of the change you are committing. For example:
Add CI/CD workflows for Dev stage. -
Description (Optional): Provide additional context for your team, especially if the commit involves multiple steps or dependencies. Useful for complex changes or when multiple stakeholders are reviewing the commit. For example:
Added GitHub Actions YAML files for Dev environment build, test, and deployment automation. Includes SonarQube analysis and artifact publishing configuration. -
Branch Selection:
You can choose where to commit the workflow files in the GitHub repository.
-
Commit directly to the default branch: The workflows become active immediately in your repository. Choose this option for urgent changes or when you are confident the workflows are ready for production use.
-
Create a new branch: Commits the files to a separate branch, allowing review and testing before merging into the default branch. This is useful for collaborative environments where changes need to be peer-reviewed.
After filling in the fields, click Commit to save the workflow files.
These files will then be available in your repository’s
.github/workflows/folder, and GitHub Actions will start using them according to the triggers defined in the YAML files. -
4. Run the CI Pipeline
-
On the technology card, click the ellipsis (...).
-
Click Run CI Pipeline.

After the CI pipeline starts, the CI status changes to CI pipeline in progress.

-
Click Refresh in the top right to update the status.

-
After the pipeline completes, the CI status changes to CI pipeline success.
-
To check real-time progress of your CI pipeline,
Go to the CI/CD Pipeline tab.
In the Continuous Integration (CI) pipeline for the technology being deployed, review each step:
-
Set Up Job – Starts the GitHub Actions job on the runner and prepares the execution context (job workspace, environment variables, permissions, and required runner setup).
-
Pull Snyk / Snyk Docker – Downloads required Snyk components for security scanning.
-
Checkout Code – Checks out the application source code from the configured source repository into the GitHub Actions runner workspace using the specified commit or branch.
-
Initialization – Prepares the build environment by setting up required runtimes/tools and pipeline prerequisites (for example, language runtime, package managers, Docker/Buildx, and any required CLIs).
-
Build – Compiles/builds the application and produces the build output required for packaging (for example, npm build, mvn package, gradle build, etc., depending on the technology).
-
Unit Tests – Executes automated unit tests and reports the result back to the pipeline. The CI run fails if tests fail.
-
SonarQube Scan – Performs static code analysis for code quality and security.
-
Build Container Image – Creates a Docker image of the application from the repository (typically using the Dockerfile and build context) and tags the image for downstream scanning and publishing.
-
Snyk Installation – Installs the Snyk CLI in the pipeline.
-
Snyk Monitor – Publishes the project snapshot to Snyk so vulnerabilities can be tracked over time in the Snyk dashboard (baseline tracking and ongoing monitoring).
-
Container Image Scan – Scans the built container image for vulnerabilities based on the configured severity gate. The CI pipeline fails when detected vulnerabilities exceed the selected threshold.
-
Publish Container Image – Pushes the built (and approved) container image to the configured container registry, so it can be pulled during deployment.
-
Push to Collector – Sends CI execution metadata, stage results, and relevant logs to Calibo Accelerate for traceability, audit history, and pipeline visualization.
-
Post Checkout Code - Performs workspace cleanup after CI execution (removes checked-out files, temp artifacts, cached data created during the run).
-
Complete Job- Finalizes the CI workflow run and marks the execution status (Success/Failure) in the CI/CD Pipelines view.
-
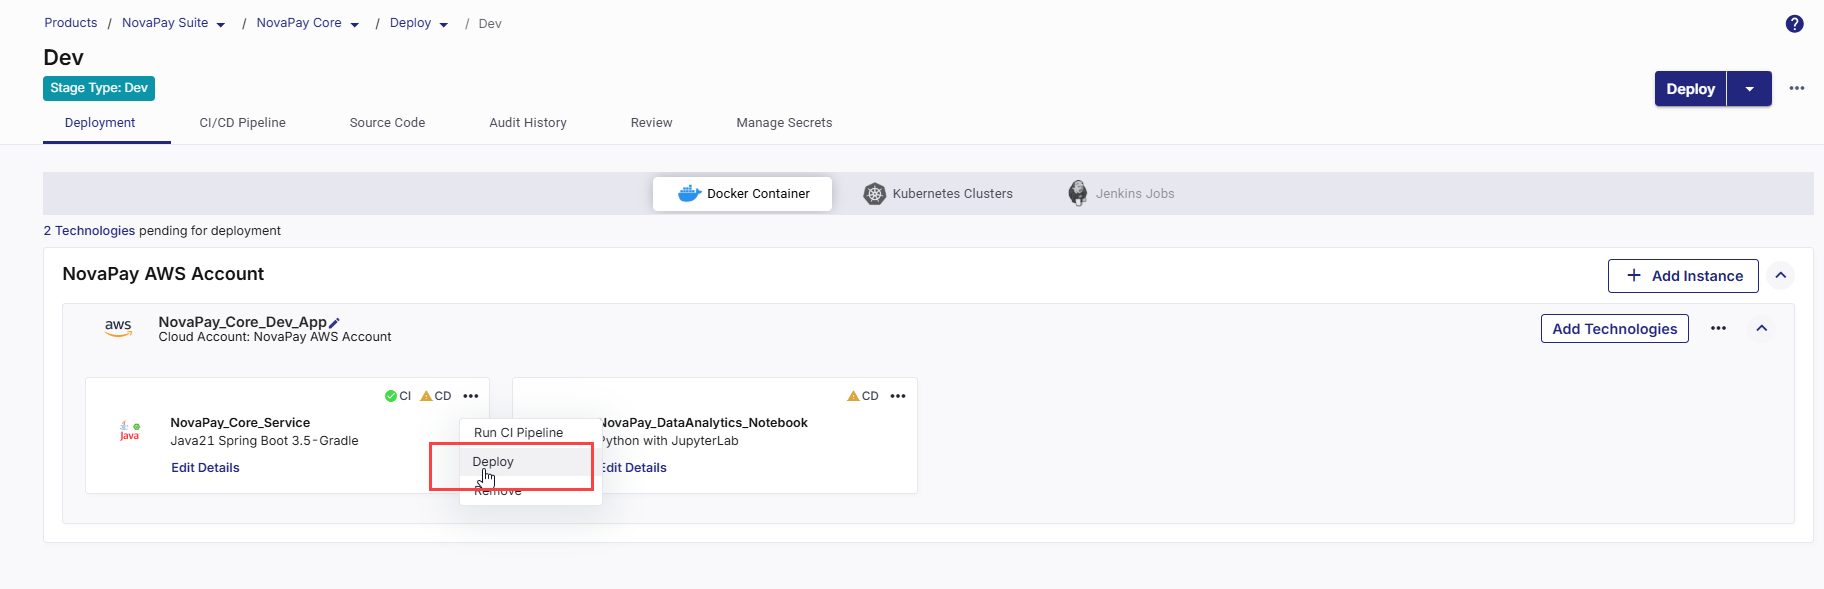
5. Deploy the Technology
After CI is successful, you can deploy the technology to the container.
-
On the technology card, click the ellipsis (...).
-
Click Deploy.
-
In the Deploy side drawer:
-
In the Container Image Tag list, choose the tag you want to deploy (for example, latest or a version number).
-
Click Deploy.

CD status changes to Pipeline build is in progress.
-
- Click Refresh in the top right to update the status. After the deployment is complete, CD status changes to Deployed.

6. View Deployment Details
-
Click View Details on the technology card to check the following:
-
Basic Details

-
Instance name with memory and CPU configuration
-
Context path from deployment configuration
-
Links to:
-
CI Pipeline (GitHub Actions CI workflow run)
-
CD Pipeline (GitHub Actions CD workflow run)
-
Artifactory (JFrog or ECR image repository)
-
-
Live Application – Click Browse to open the deployed application. It may take a few minutes for the application to become accessible after a successful deployment through Calibo Accelerate.
-
Security Scan (Snyk)
This section displays the latest Snyk security scan results for the deployed application’s container image.
-
Scan Summary
Displays a consolidated view of detected vulnerabilities, categorized by severity: Critical, High, Medium, and Low. -
Project Link
Clicking the project name (for example, NovaPay_Core_Service) opens the corresponding Snyk project in a new browser tab, allowing you to review detailed findings directly in Snyk.
-
Last Scan Timestamp
Indicates the date and time when the most recent security scan was executed, providing auditability and traceability. -
Vulnerabilities
Click the expand icon next to Vulnerabilities to view the complete list of detected issues, including:
-
Component or package name
-
Vulnerability type
-
Severity level
-
CVE ID (where applicable)
-
Fix availability
-
CVSS score
-
-
Dependencies
Click the expand icon next to Dependencies to view detailed dependency information, including:-
Dependency name and version
-
Number of associated issues
-
Severity-wise issue distribution (Critical, High, Medium, Low)
-
This helps identify affected packages and versions, enabling faster remediation and improved traceability.
-
-
-
Continuous Integration Tab
-
Displays the selected Source Code Branch
-
Shows the Pipeline Trigger (Manual, Code Change, or Schedule)

-
Displays the Snyk settings applied to the technology for the Continuous Integration pipeline.
-
Project
Shows the name of the Snyk project linked to this technology.Calibo Accelerate uses this project to publish scan results and track vulnerabilities for the application in Snyk. -
Severity
Displays the vulnerability severity level configured as the security gate for the CI pipeline. This setting determines whether the pipeline fails based on detected vulnerabilities.
-
-
-
Continuous Deployment Tab
Shows the following details configured in the deployment configuration:
-
Host Port Number (The external port on the host system mapped to your container port.)
-
Port Number (The internal port on which your application runs inside the container.)
-
Pipeline Trigger

-
-
-
To check real-time progress of your CD pipeline, go to the CI/CD Pipelines tab. The following stages are displayed in the CD pipeline:
-
Set Up Job
Initializes the GitHub Actions job on the selected runner. This step prepares the execution context by setting up the workspace, environment variables, permissions, and runtime prerequisites required for deployment. -
Checkout Code
Retrieves the application source code and deployment configuration files from the configured repository. This ensures the deployment uses the correct commit and associated artifacts. -
Initialization
Sets up deployment-specific prerequisites on the runner, including required CLIs, Docker tooling, authentication contexts, and configuration files needed to execute the deployment workflow. -
Deploy to VM
Deploys the application to the target virtual machine using Docker. This step pulls the required container image from the registry (or uses a previously published image), starts or updates the container on the VM, and applies the defined runtime configuration. -
Push to Collector
Sends deployment execution details, status, and logs to Calibo Accelerate. This information is used for deployment visibility, auditing, traceability, and troubleshooting. -
Post Checkout Code
Performs post-deployment cleanup by removing checked-out repository files and temporary resources created during execution, ensuring the runner workspace is left in a clean state. -
Complete Job
Finalizes the deployment workflow and marks the job as completed. The overall deployment status (success or failure) is recorded and reflected in the CD pipeline view.
-
Uninstall a Technology
When a technology is no longer required in your product or pipeline, you can uninstall it from Calibo Accelerate. Uninstalling a technology removes its configuration and also deletes the associated Continuous Integration (CI) and Continuous Deployment (CD) jobs from the configured CI/CD tool.
This ensures your product remains clean and that no unnecessary jobs are executed in the background.
To uninstall a technology, do the following:
-
On the technology card, click the ellipsis (...) menu in the upper-right corner.
-
From the dropdown menu, select Uninstall.

-
A confirmation dialog box appears.
-
Click Uninstall to proceed.

-
Click Cancel if you want to retain the technology.
-
-
Once confirmed:
-
The selected technology is uninstalled from Calibo Accelerate.
-
Related CI and CD jobs are deleted automatically from the connected CI/CD tool.
-
Edit Technology Details
After a technology is added to your product, you may need to update its deployment configurations over time. For example, you might want to adjust the context path, update CI/CD settings, or modify functional testing parameters.
To edit technology details, do the following:
-
On the technology card, click the ellipsis (...) menu in the upper-right corner.
-
From the dropdown menu, select Edit Details.

This opens the deployment configuration details for the selected technology.
-
Modify the desired settings.
-
Save your changes.
With the updated configuration in place, you can now trigger the CI pipeline and deploy the technology to the selected environment.
|
What's next? Data Pipeline Studio |