Enabling Logging and Monitoring for Calibo Accelerate Orchestrator Agent by Using Azure Monitor
We recommend that you enable logging and monitoring for Calibo Accelerate Orchestrator Agent. You can use Azure Monitor to collect, aggregate, and summarize metrics and logs from the Calibo Accelerate Orchestrator Agent running in your Microsoft AKS cluster.
Setting up Azure Monitor
-
Create a Log Analytics workspace in your Azure subscription by using the following Azure CLI command. Replace
<MyResourceGroup>and<myWorkspace>with your desired resource group and workspace names, respectively.Copyaz monitor log-analytics workspace create --resource-group <MyResourceGroup> --workspace-name <myWorkspace> -
Obtain the Log Analytics workspace ID by using the following command. This unique identifier will be required for subsequent configuration steps.
Copyaz monitor log-analytics workspace show --resource-group <MyResourceGroup> --workspace-name <myWorkspace> --query id -o tsv -
Enable Azure Monitor on the AKS cluster by using the following command. Specify the cluster name (
<cluster-name>), resource group name (<cluster-resource-group-name>), and the workspace resource ID (<workspace-resource-id>) obtained in the previous step.Copyaz aks enable-addons -a monitoring -n <cluster-name> -g <cluster-resource-group-name> --workspace-resource-id <workspace-resource-id>
It may take a few hours to populate the data in Azure.
Viewing Calibo Accelerate Orchestrator Agent Pod Logs
You can access your Calibo Accelerate Orchestrator Agent pod logs by using either of the following methods:
-
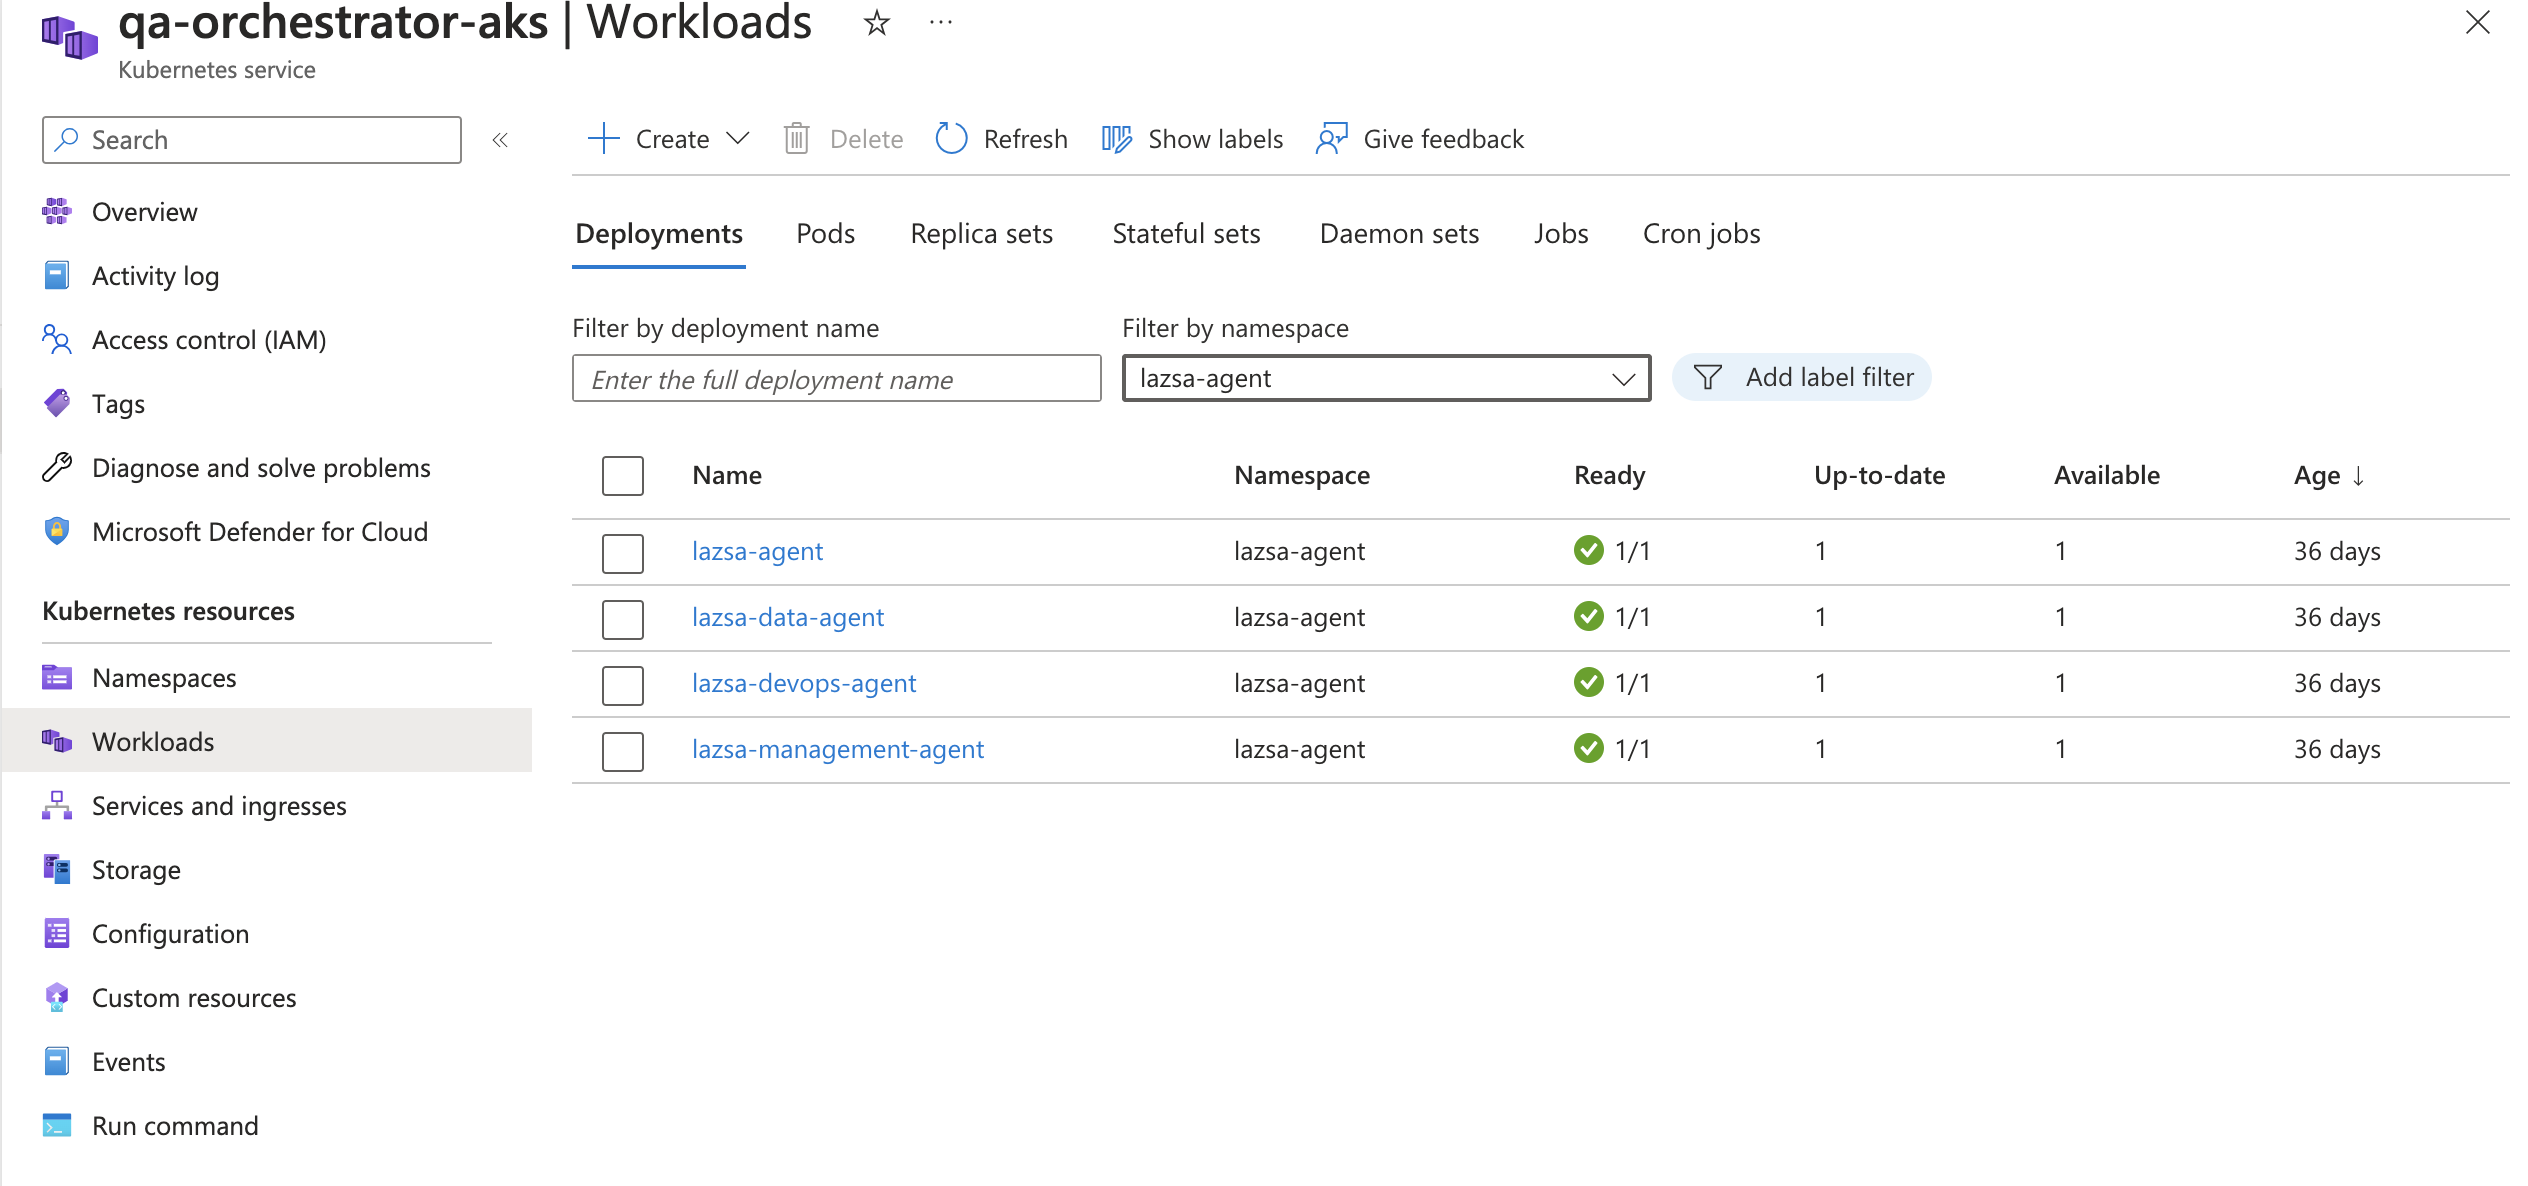
Azure Kubernetes Service workloads
- In the Azure portal, navigate to Kubernetes Service.
- Select your AKS cluster.
- Go to Workloads, and select Pods.
- In the Filter by namespace, Enter lazsa-agent. You can see the four pods created under the lazsa-agent namespace. Each pod represents a dedicated Calibo Accelerate Orchestrator Agent service.
- Select a pod, and then select Live Logs.
-
Log Analytics
In Log Analytics, navigate to your workspace, select Logs, and execute queries to retrieve the desired logs. To search a specific keyword in the logs, add | search "keyword" to the query.
Copylet startTimestamp = ago(1h);
KubePodInventory
| where TimeGenerated > startTimestamp
| project ContainerID, PodName=Name, Namespace
| where PodName contains "lazsa" and Namespace startswith "default"
| distinct ContainerID, PodName
| join
(
ContainerLog
| where TimeGenerated > startTimestamp
)
on ContainerID
| search "GET"
| project TimeGenerated, LogEntry
| order by TimeGenerated desc
Monitoring Cluster Metrics
In the Azure portal, monitor cluster metrics in the Monitoring section of the cluster view.
- Select your AKS cluster and go to Monitoring > Insights.
- Use the + Add Filter option at the top of the page to filter the results for the view by Service, Node, Namespace, or Node Pool. Select the lazsa-agent namespace.
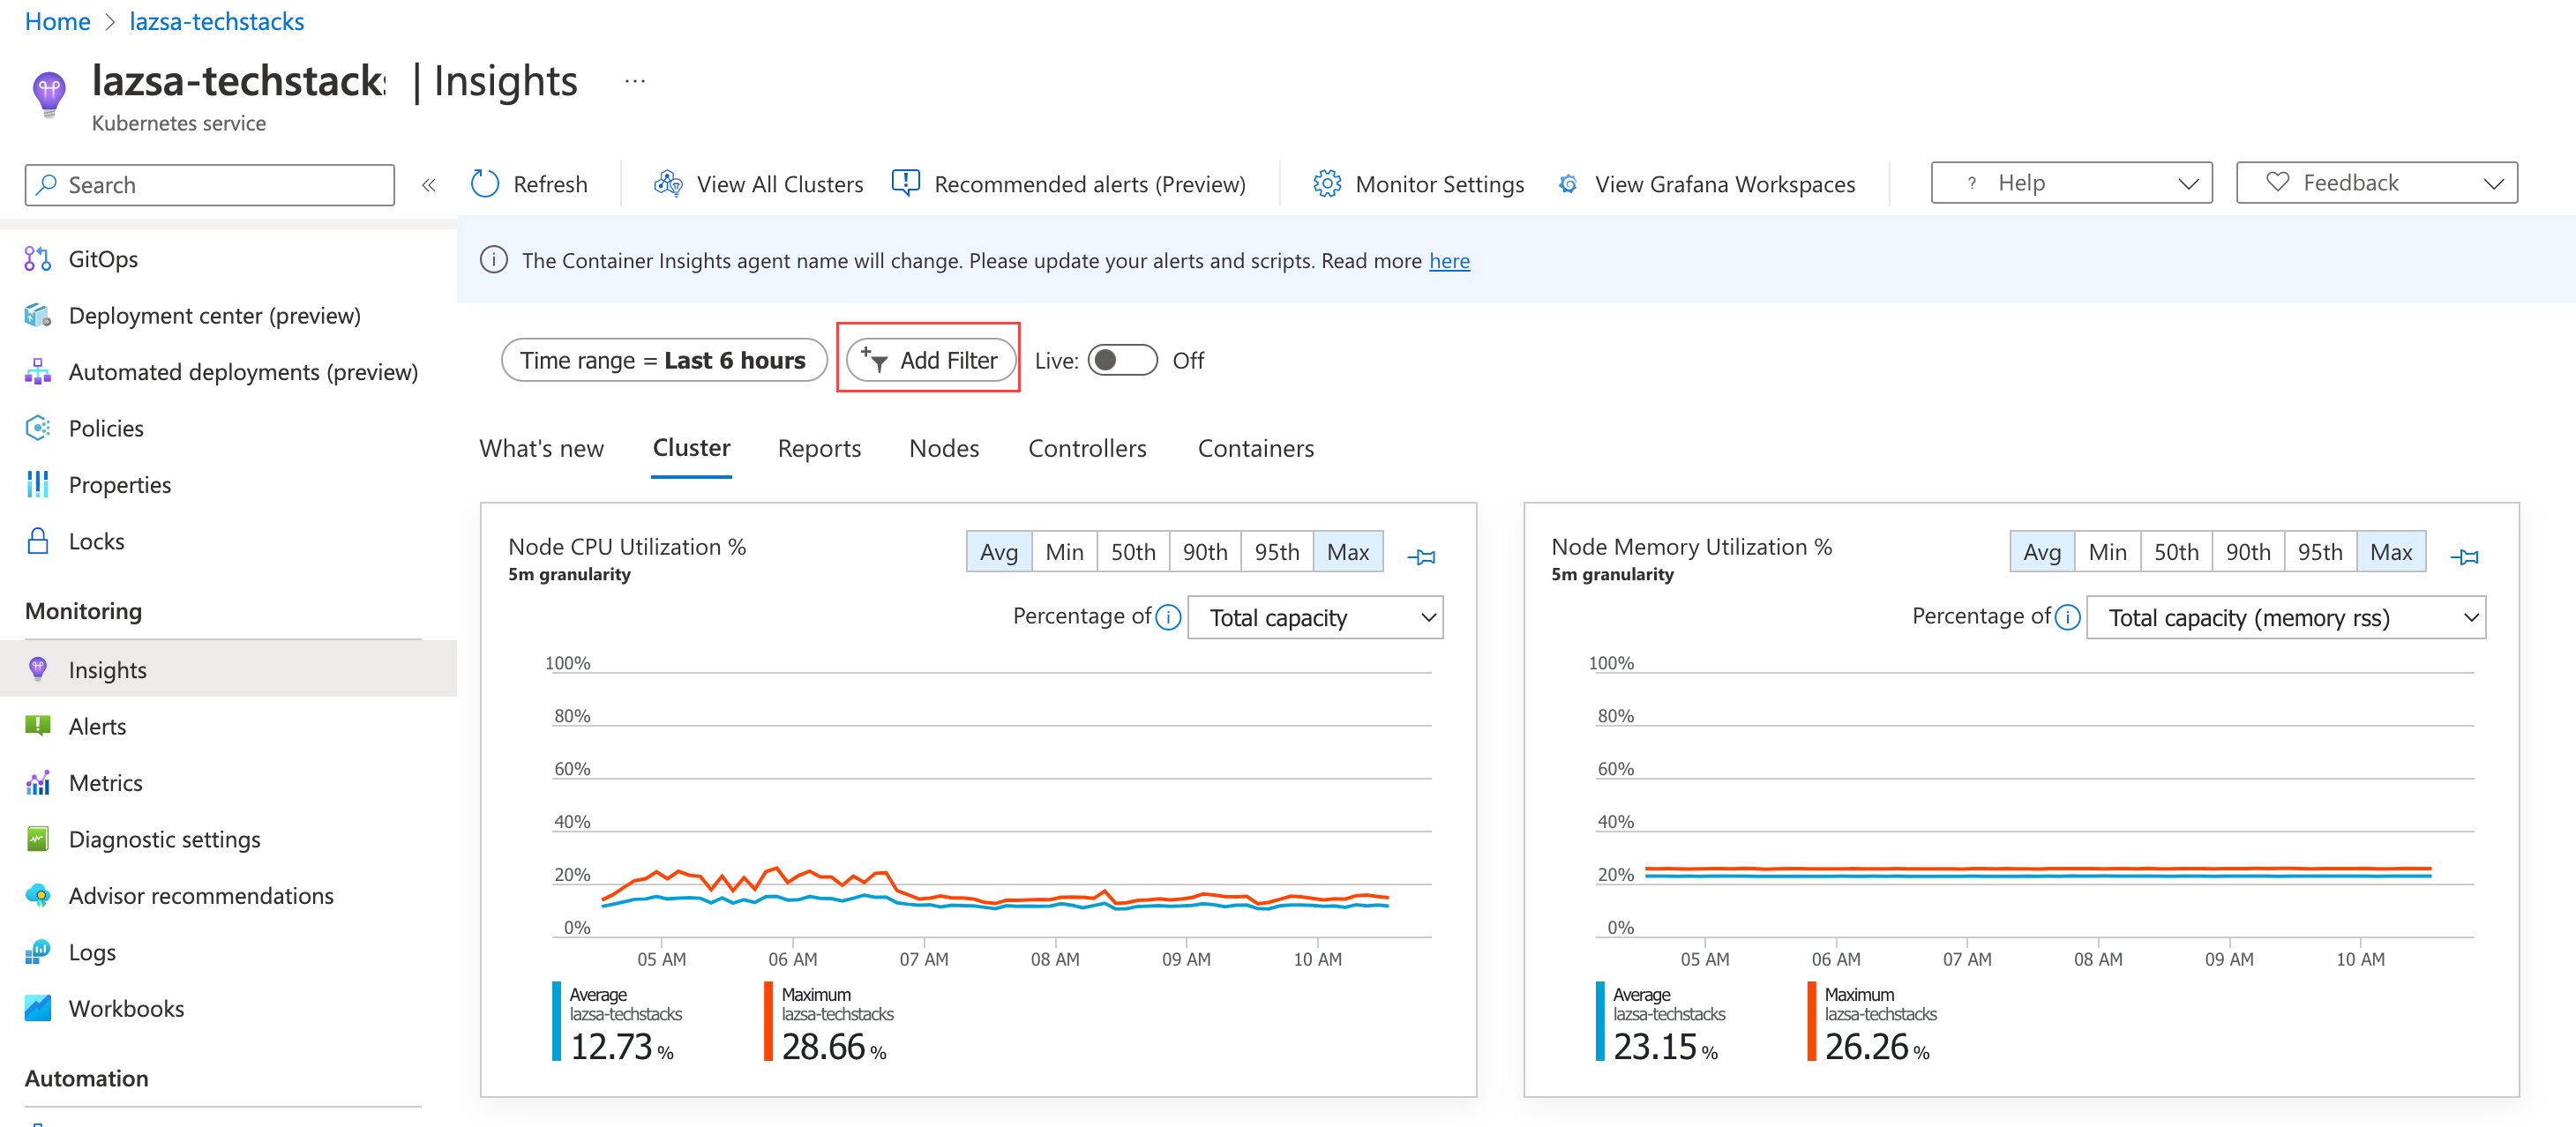
- To views various metrics collected for your cluster, go to each of the following tabs:
- Cluster
- Reports
- Nodes
- Controller
- Containers
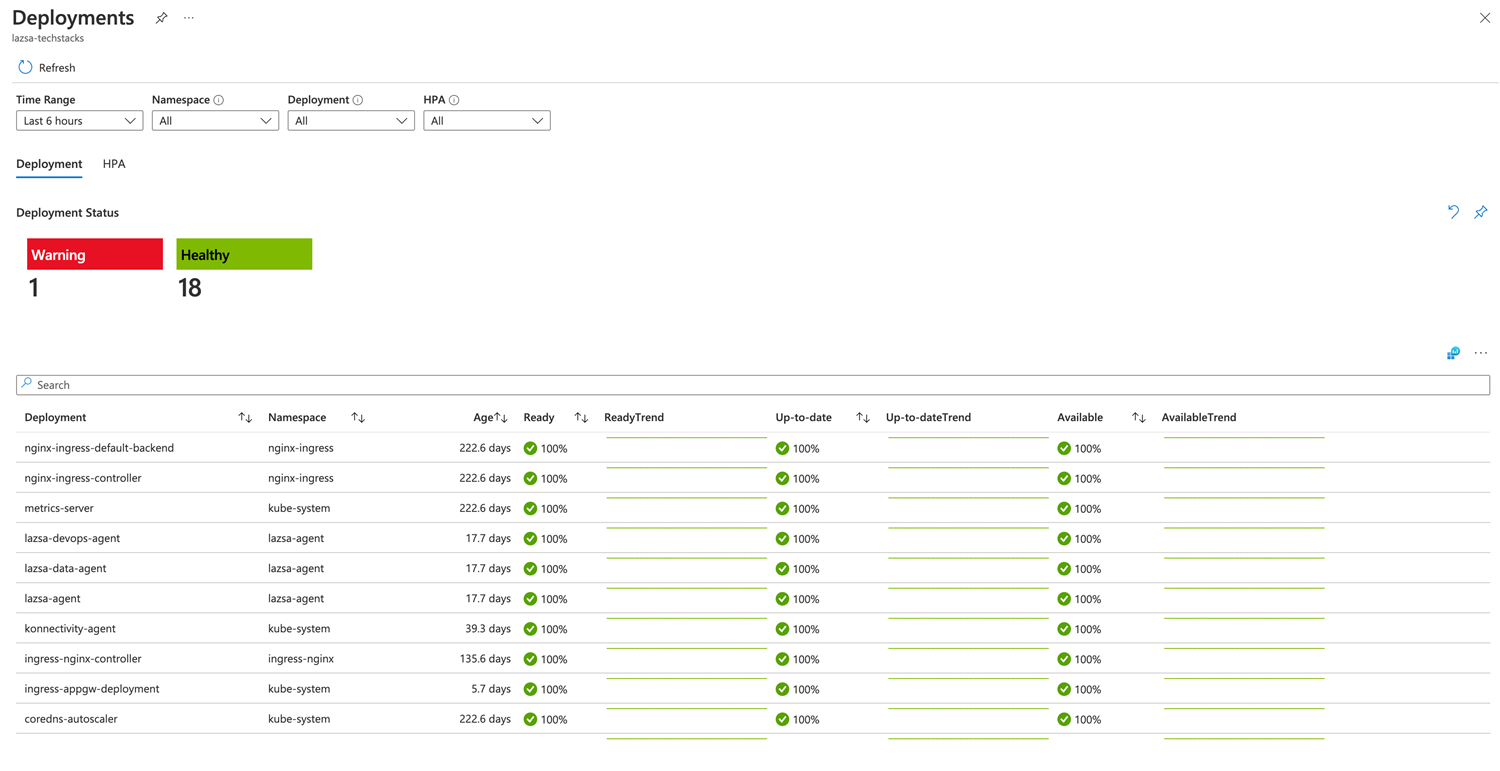
In the Reports section, deployment reports and workload reports are useful for monitoring the status of the pods created within the lazsa-agent namespace.
Setting Up Alerts
Create alerts for critical metrics such as pod restarts, resource overload, out-of-memory incidents, or instances of pods not running, among others. Define alert rules and specify actions to be taken, such as sending email notifications, based on predefined thresholds. To set up alerts for Calibo Accelerate Orchestrator Agent in Azure Monitoring, do the following:
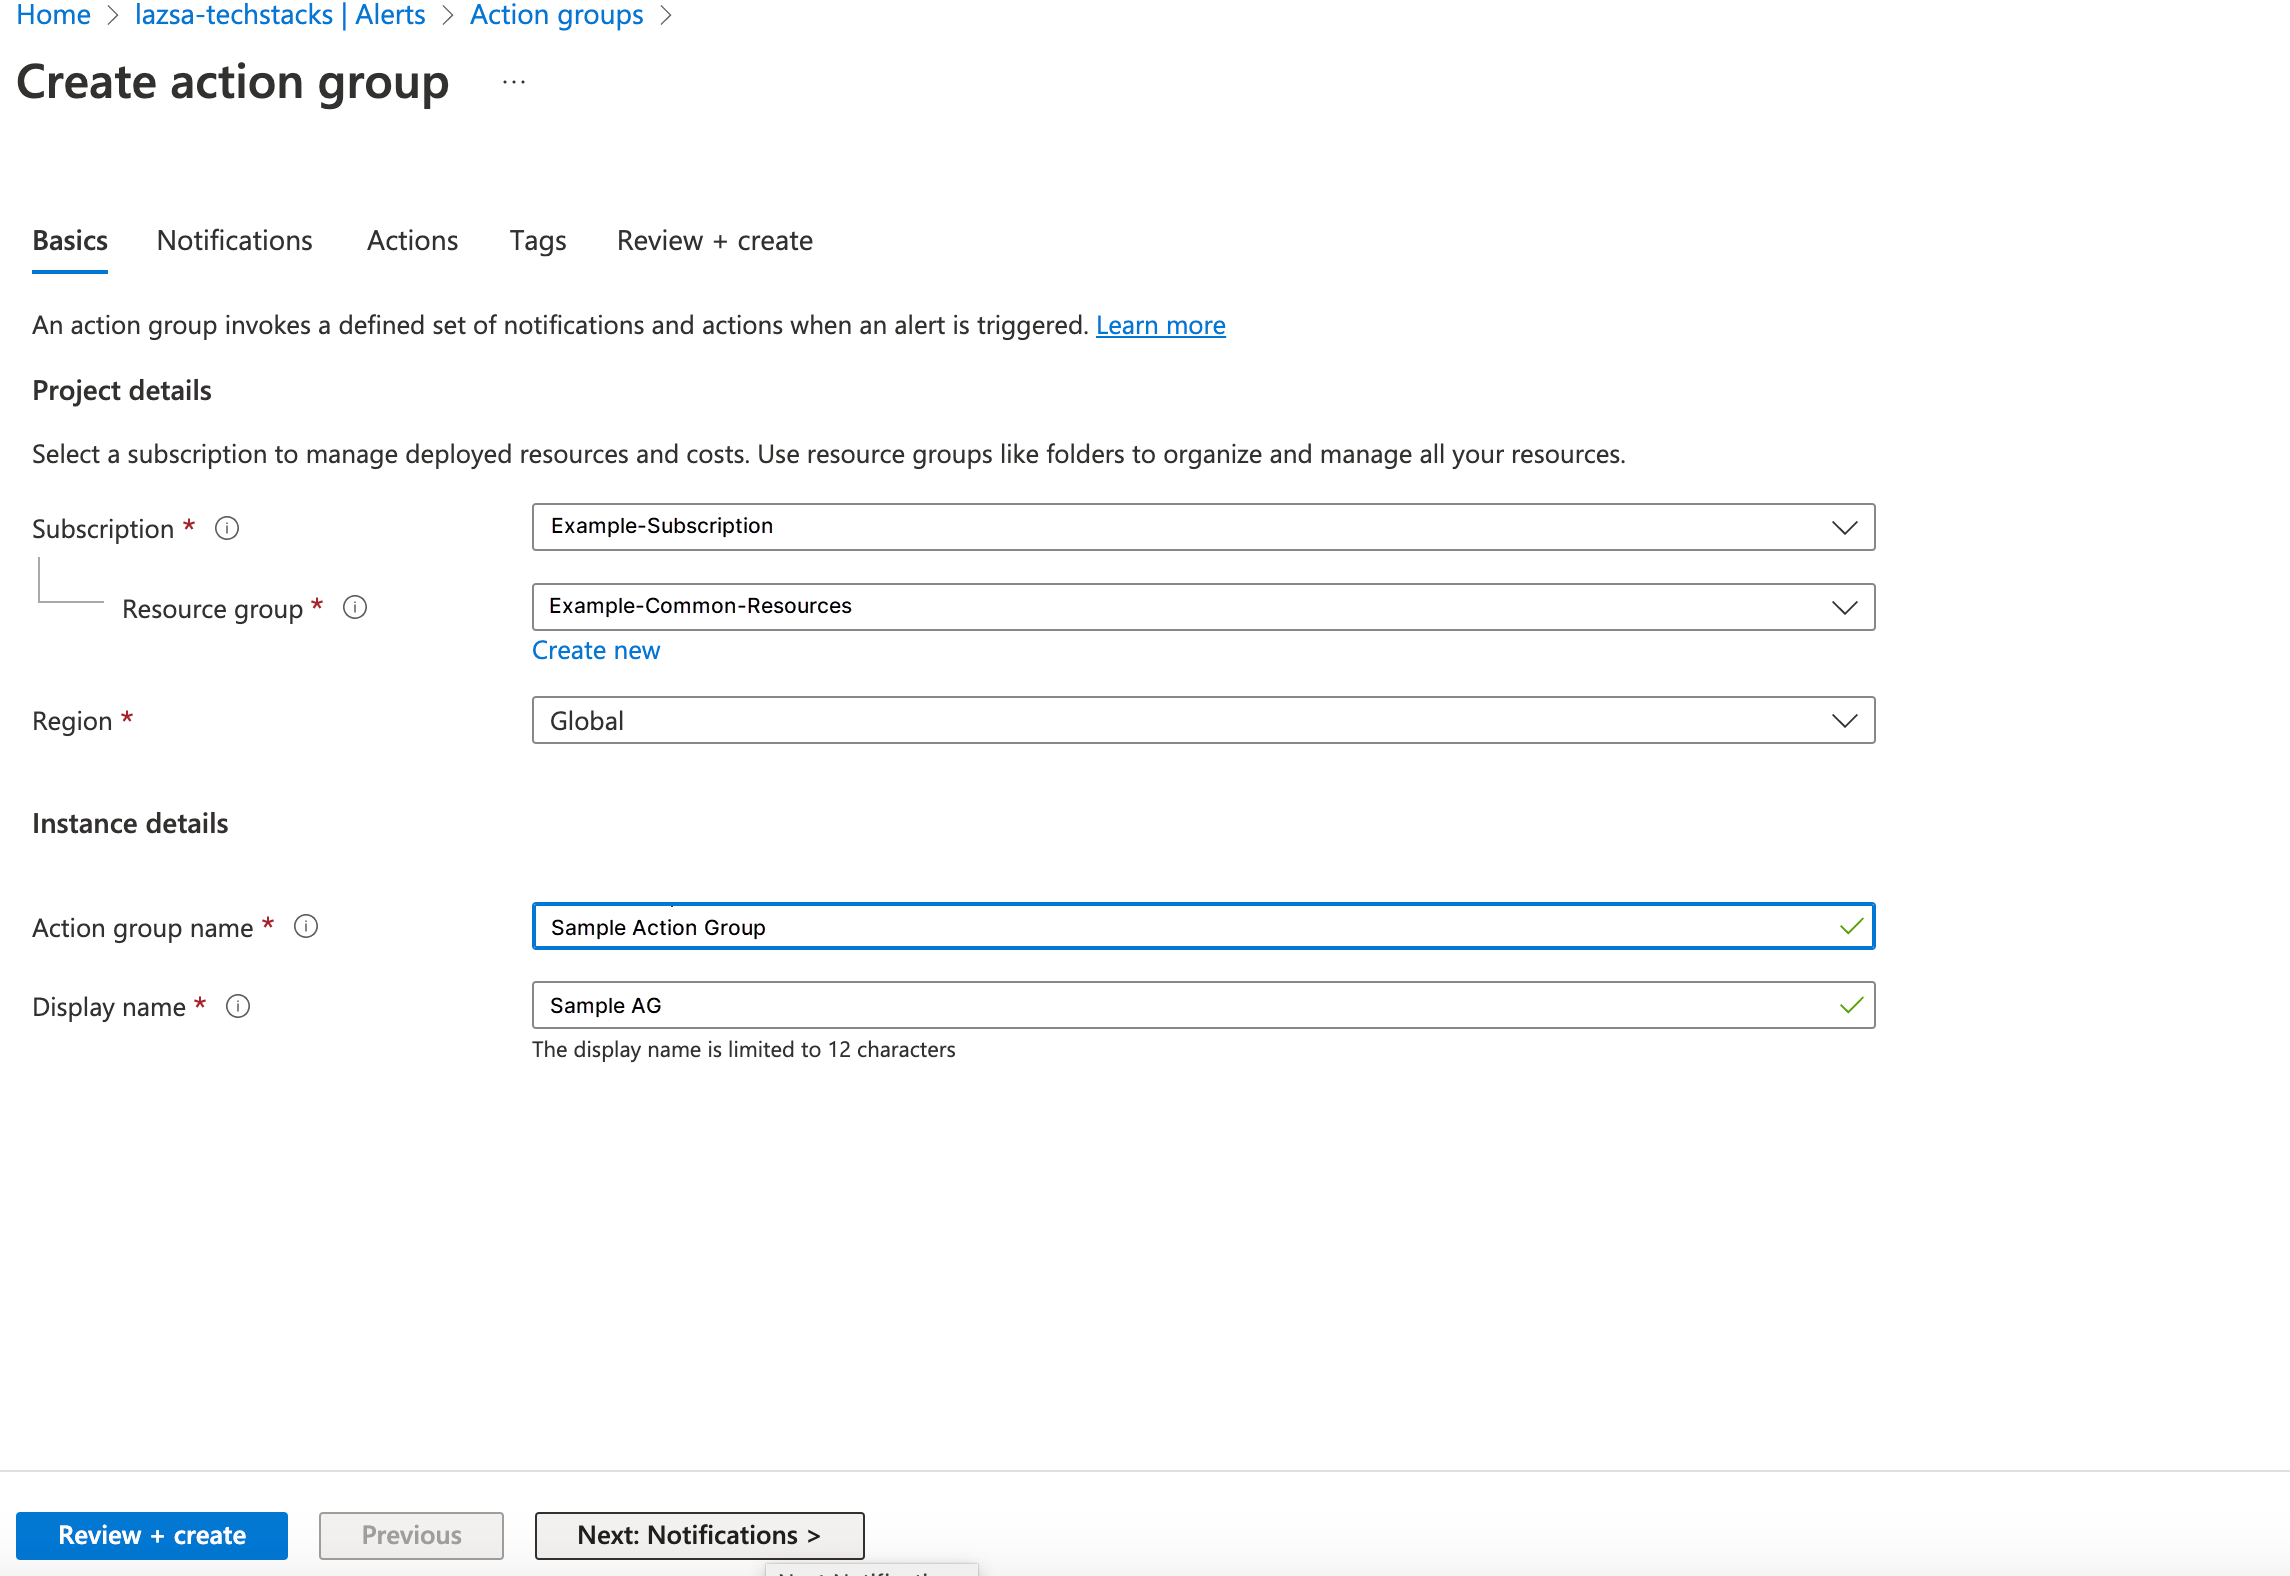
- In the Azure portal, create an action group for an alert. Select your AKS cluster and go to Monitoring> Alerts > Action Groups.
- Click Create.
Configure basic action group settings. In the Project details section:
Select values for Subscription and Resource group.
Select the region.
The action group is saved in the subscription, region, and resource group that you select.
In the Instance details section, enter values for Action group name and Display name. The display name is used in place of a full action group name when the group is used to send notifications.
Configure notifications. Select the Notification type as Email and enter the email address Enter the email where the notification should be sent.
You can specify only one email address per notification entry. To add multiple email addresses, add multiple entries. Give a name to the notification. Click Review+create. Your action group is created.
To create an alert rule, select your AKS cluster and go to Monitoring> Alerts > +Create > Alert Rule.
On the Create an alert rule page, on the Condition tab, in the Signal type list, select Metrics.
In the Monitor service list, select insights.container/pods.
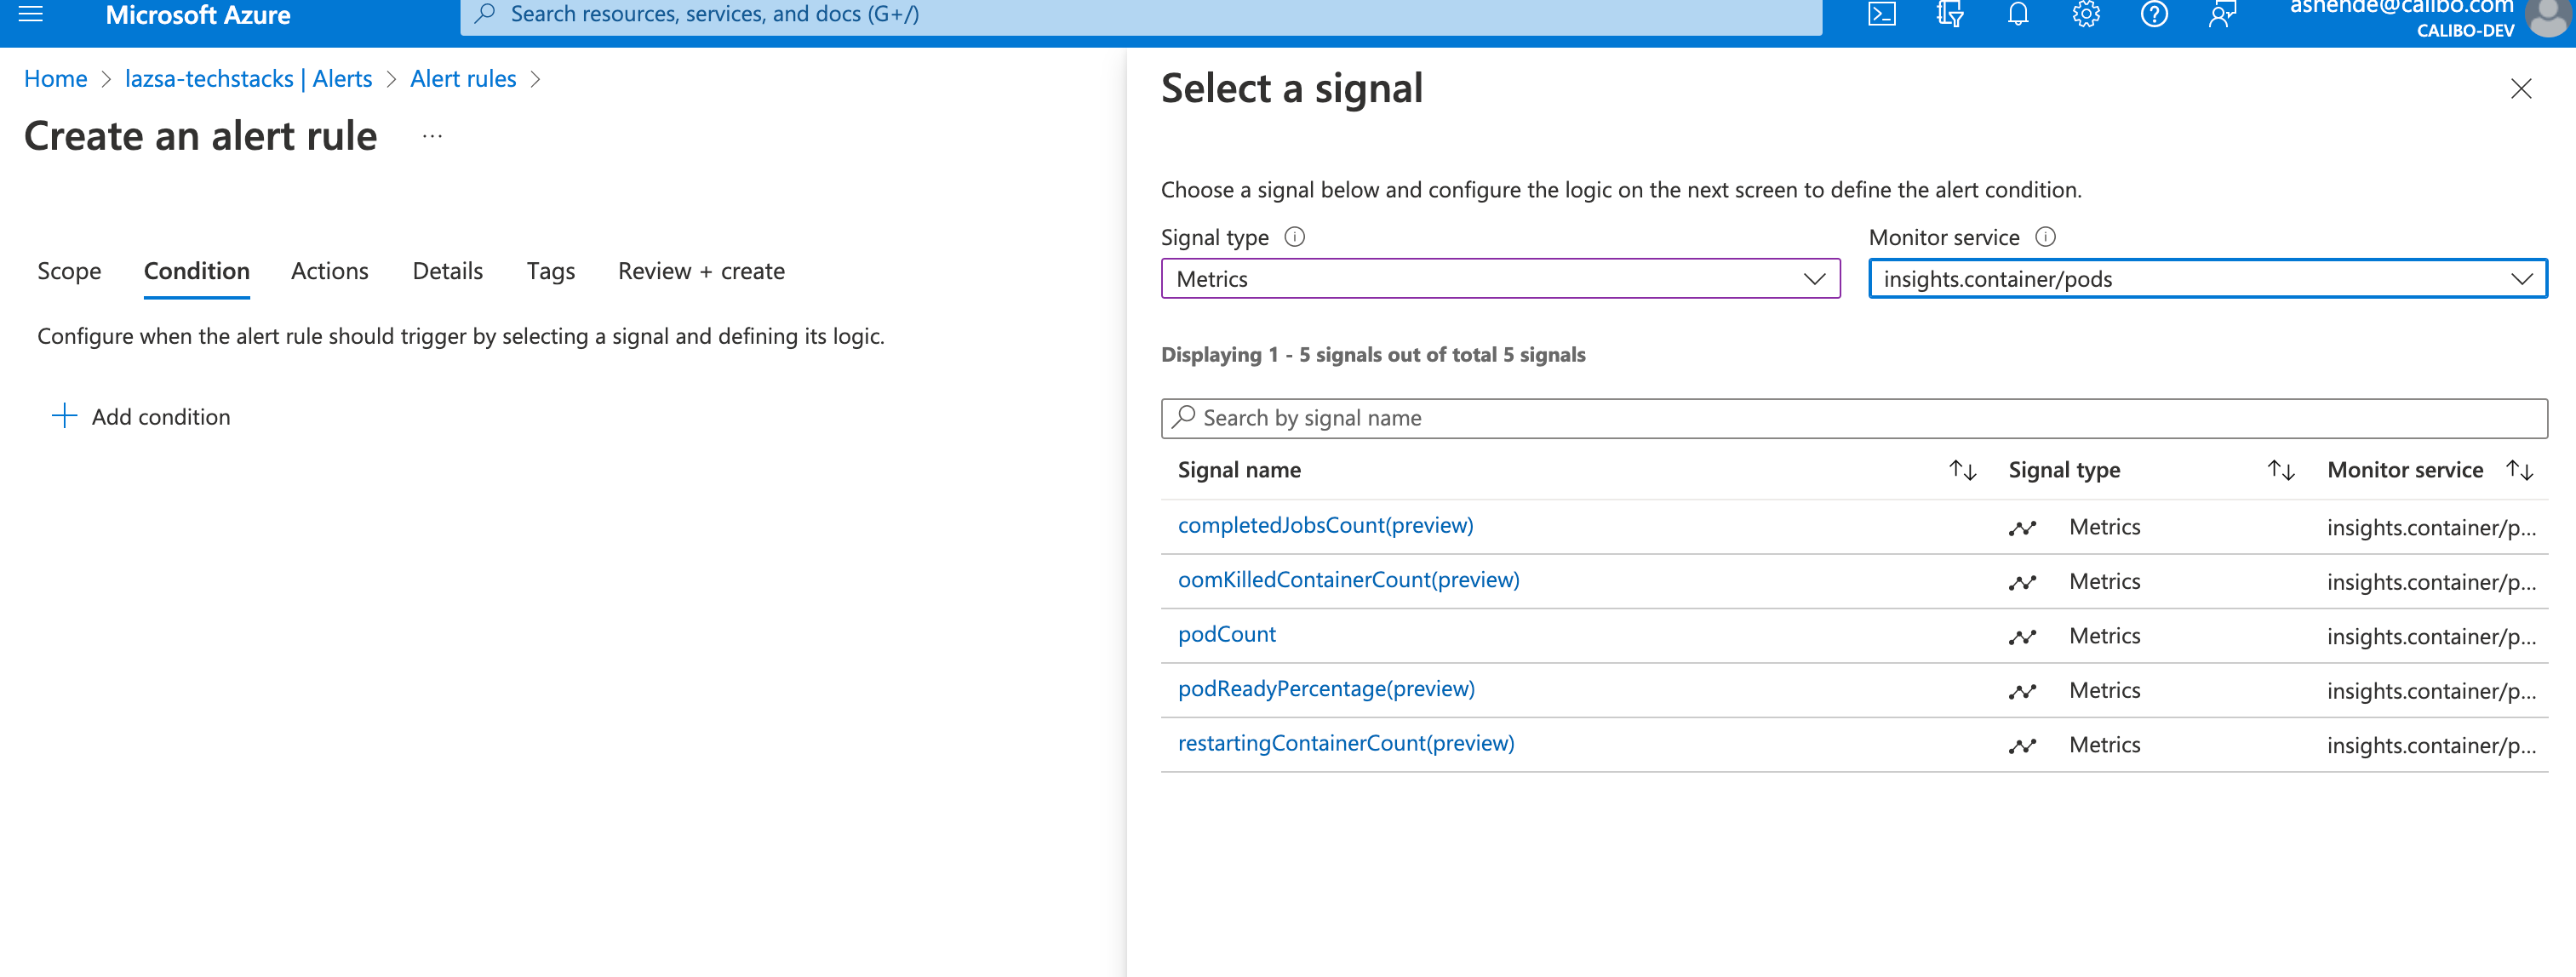
Select metrics on which you want to create alert, such as restartContainerCount, oomkilledContainerCount or podCount. As an example, let us choose restartContainerCount.
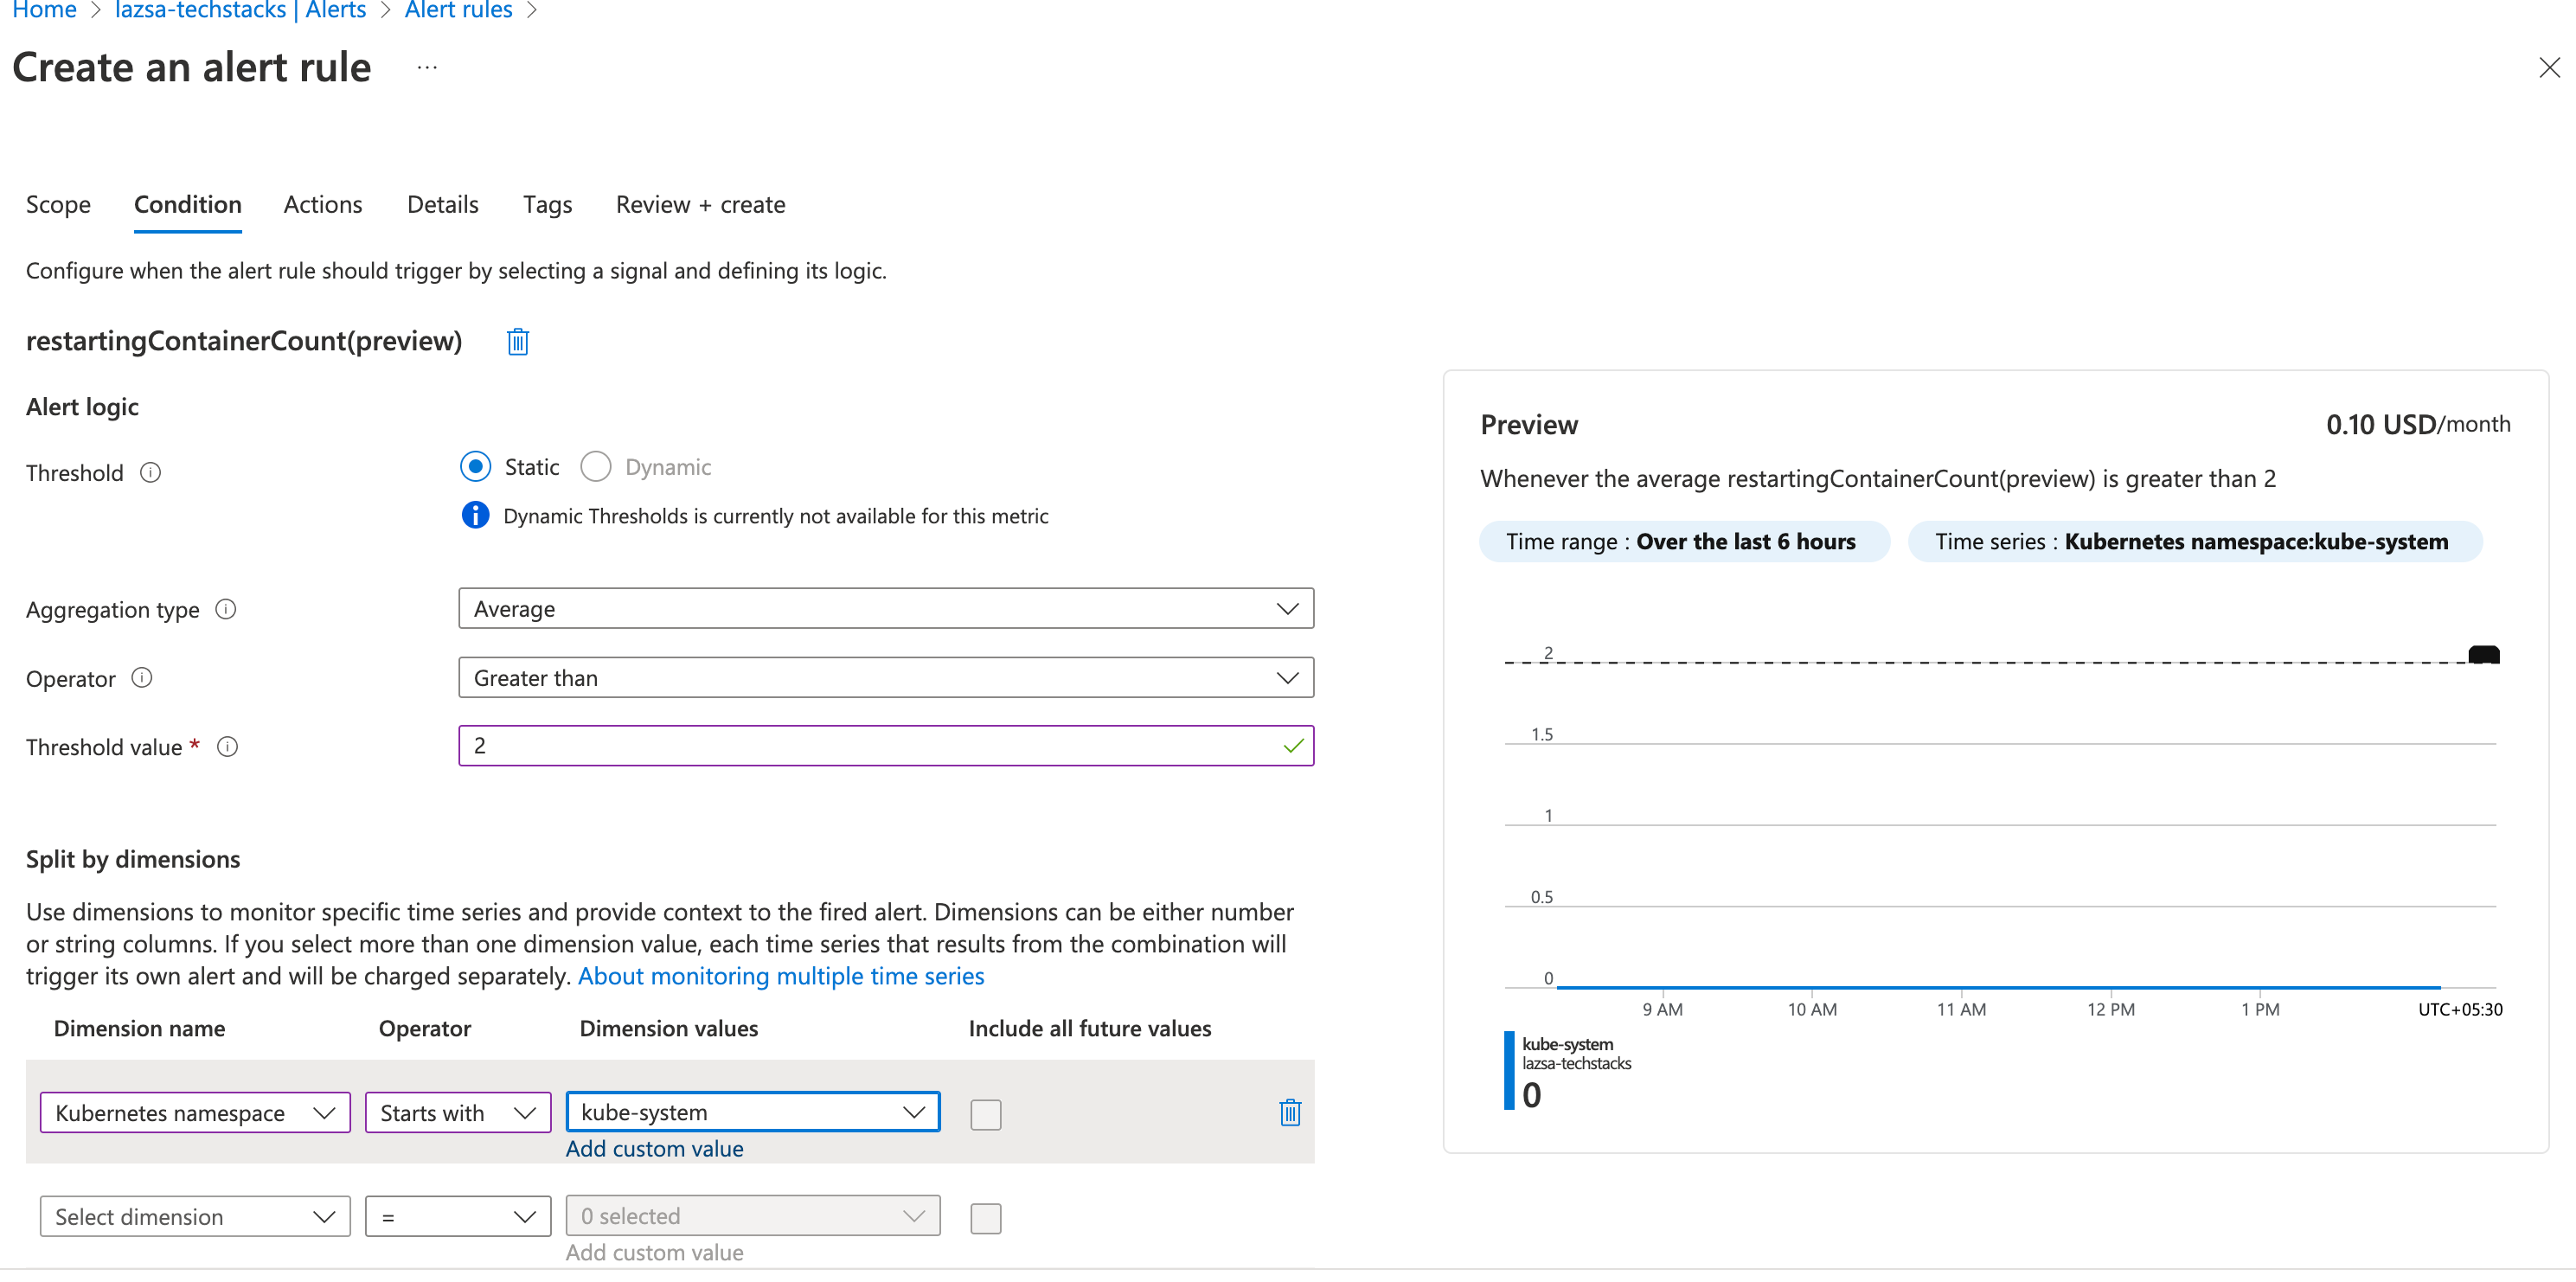
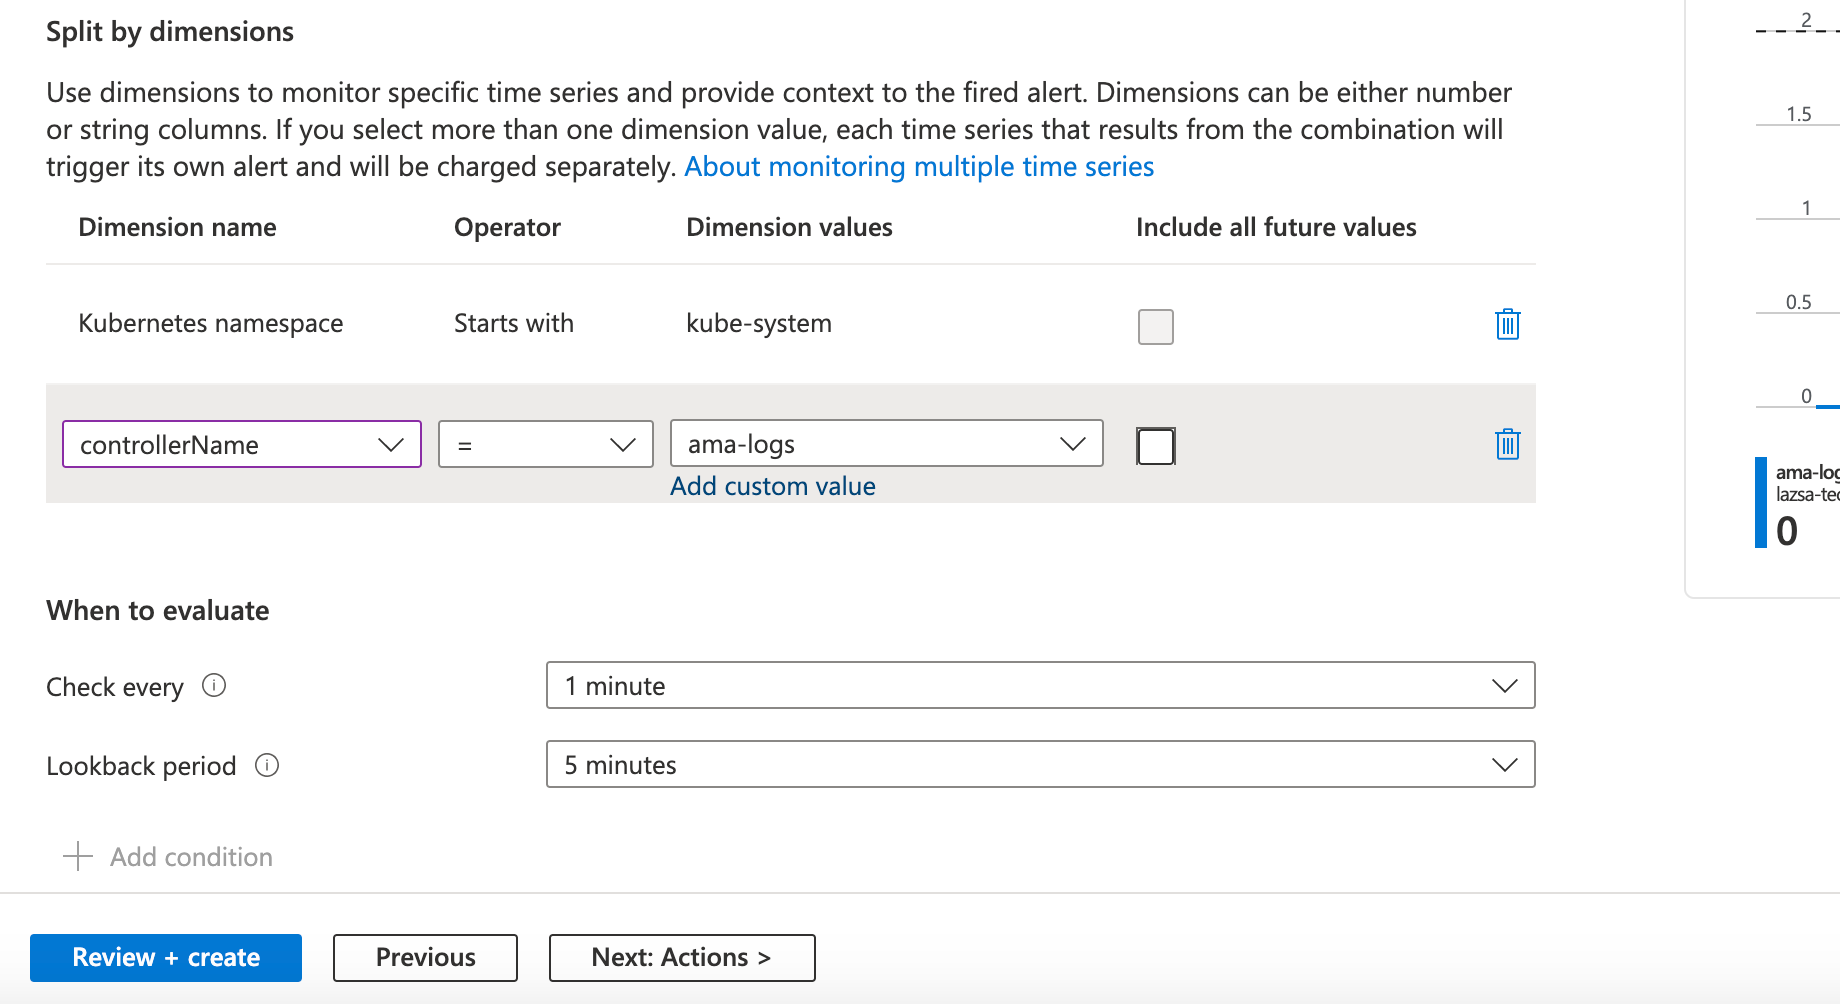
Here, you can specify a threshold value and select dimensions like the namespace (lazsa-agent) that you want to observe. You can also specify when to evaluate the condition.
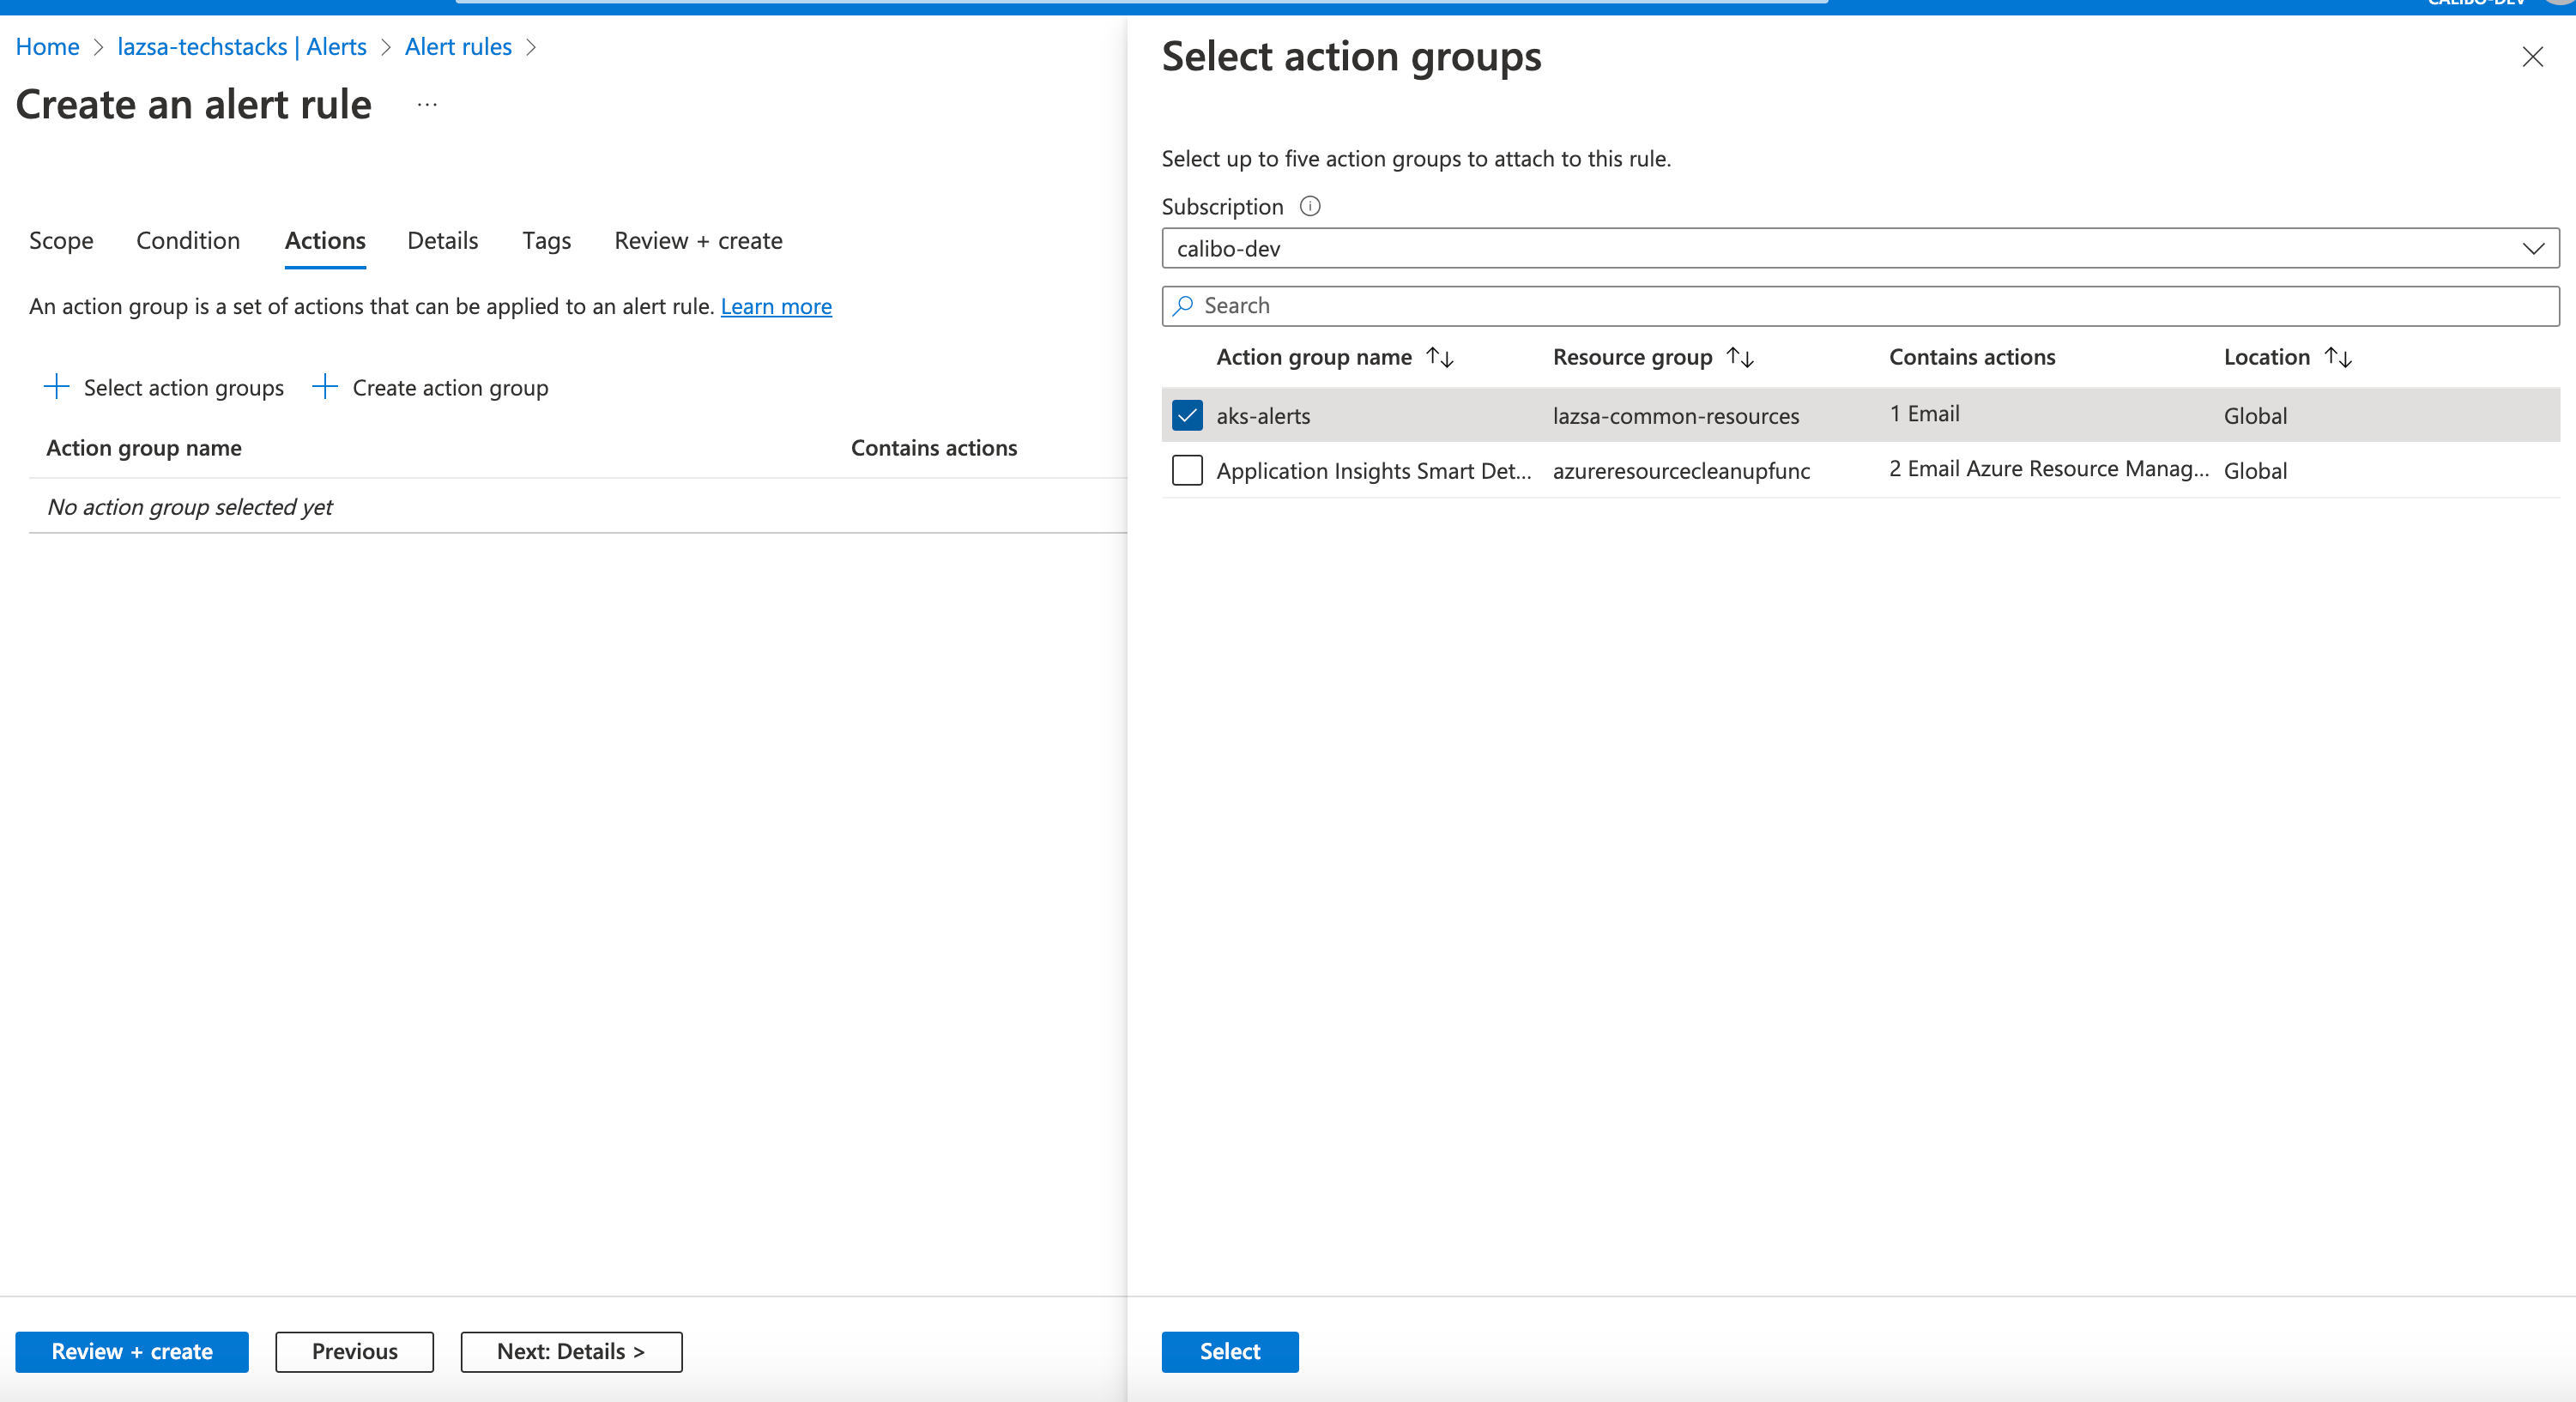
Click Next: Actions. Here you can select the action to perform. Select your desired action group.
Click Next: Details. On the Details page, give a name to your alert and define its severity.
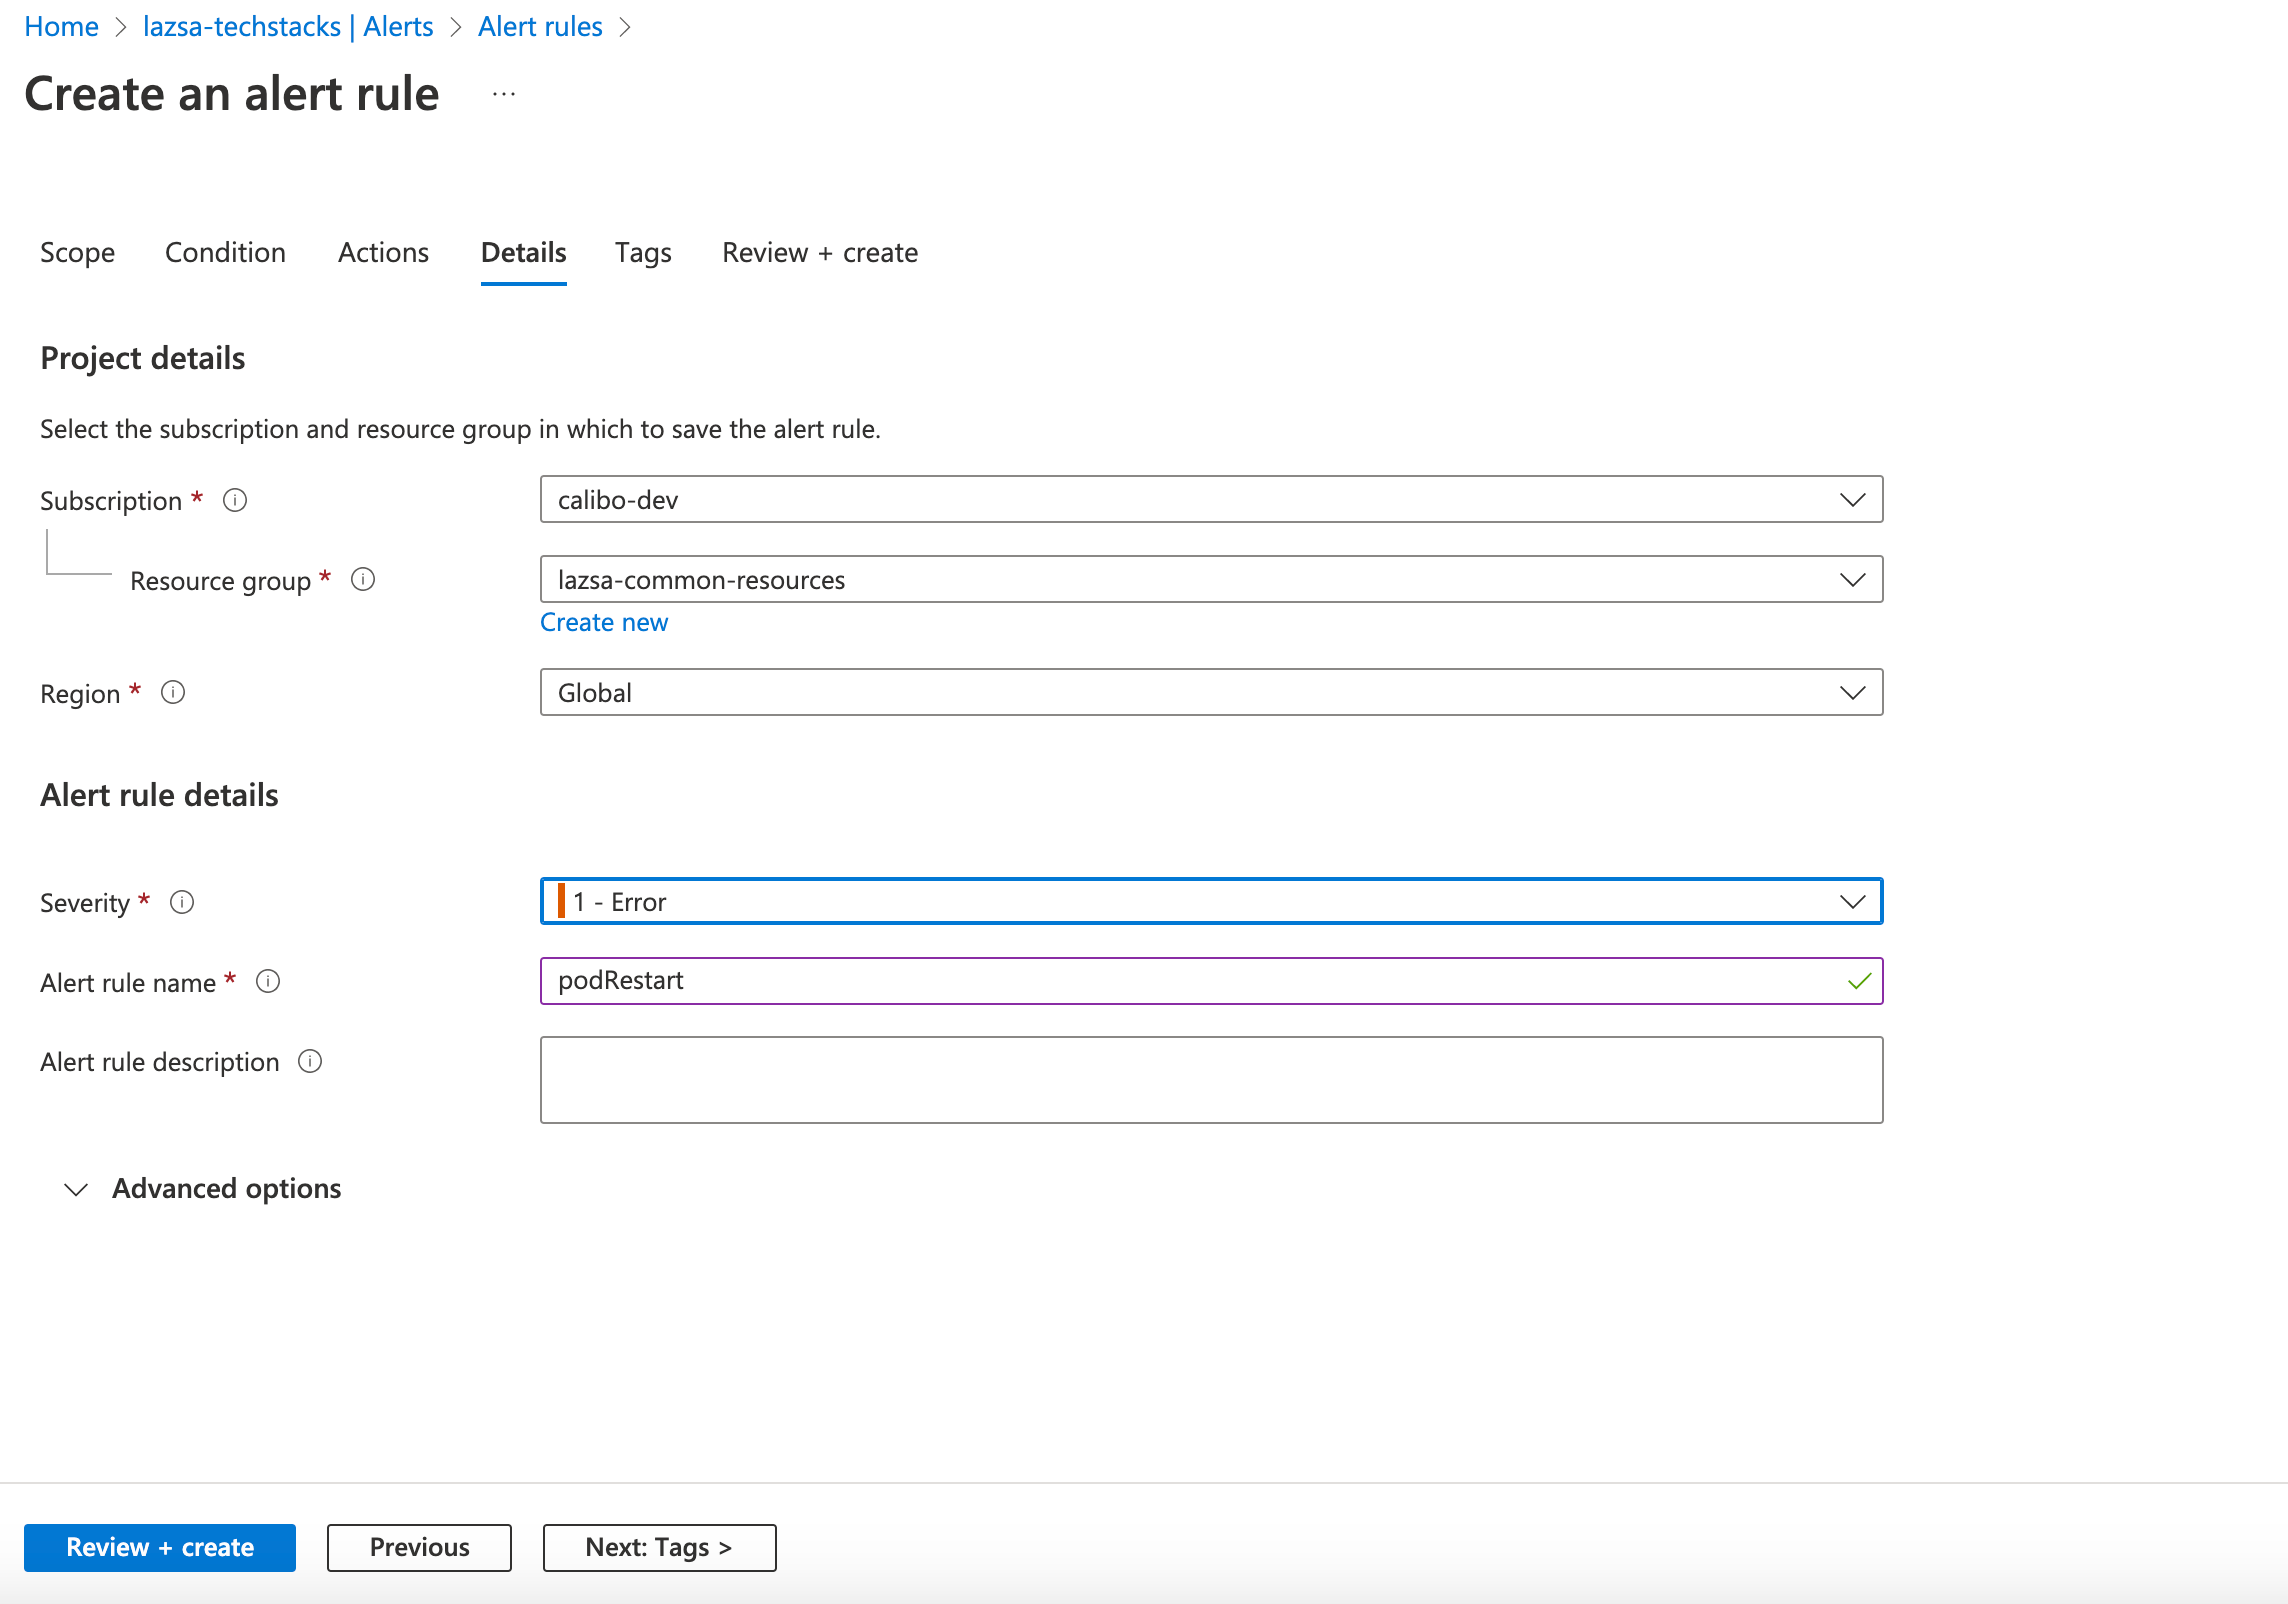
Click Review + create. Your rule is created under Alert Rules.
| What's next?Monitoring Health Status of Orchestrator Agent in Calibo Accelerate platform |