Data Quality Adapters
Data Quality ensures that the information used to make key business decisions is reliable, accurate, and complete. It is therefore crucial to ensure data quality throughout the data management process.
-
Data Quality stands as a critical factor in guaranteeing the integrity of information used for pivotal business choices, necessitating reliability, precision, and comprehensiveness. Consequently, upholding data quality across the entire data management continuum is of paramount importance.
-
This metric assesses the extent to which a dataset satisfies specific benchmarks, gauging its alignment with predetermined standards.
-
By ensuring data quality, a robust standard is maintained throughout data processing, fostering the utilization of data that is both accurate and dependable..
Ensuring the excellence of data quality encompasses a series of pivotal considerations and methodologies. The journey towards optimal data quality entails the following sequential steps:
-
Data Profiling - Looks closely at where your data comes from to see how it's structured and how good it is. This helps catch problems before they cause trouble later.
-
Data Cleansing - Removing or correcting errors, inconsistencies, and inaccuracies in the data. This may involve processes like deduplication, standardization, and validation.
-
Data Transformation Rules - Applying business rules and transformations to ensure that data is properly formatted, normalized, and conforms to the target schema.
-
Data Validation - Checking the transformed data to ensure that it meets predefined quality criteria and business rules.
-
Data Enrichment - Enhancing data with additional information from external sources to improve its completeness and relevance. For example, handling null and empty values.
-
Error Handling - Establishing mechanisms to identify and address data quality issues during the data processing.
Poor quality of data can lead to incorrect insights, inaccurate analysis, and unreliable business decisions. Organizations therefore invest significant effort in establishing robust data quality practices.
APIs and Interfaces used in Data Quality
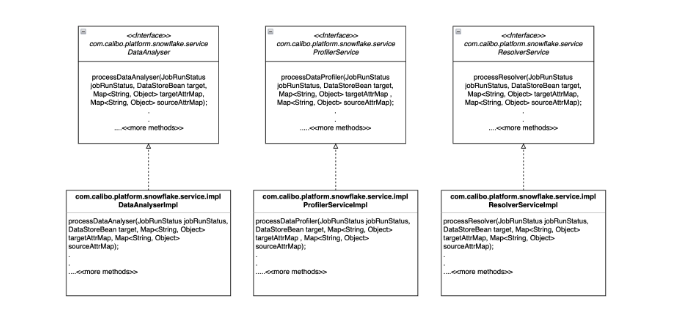
| Microservice: plf-snowflake-integration | |
|---|---|
|
Add constraints entry to Data Analyser in switch case and call applyConstraint() method with right set of paramaters Note: Other switch cases are already implemented. Class: com.calibo.platform.snowflake.service.impl.DataAnalyserImpl |
Copy
|
|
Add constraints entry to Issue Resolver in switch case and add the appropriate implementation. Note: Other switch cases are already implemented Class: com.calibo.platform.snowflake.service.impl.ResolverServiceImpl |
Copy
|
|
Add constraints entry to Data Profiler in switch case and add the appropriate implementation. Note: Other switch cases are already implemented Class: com.calibo.platform.snowflake.service.impl.ProfilerServiceImpl |
Copy
|
Following are the APIs and interfaces used in data quality:
-
CalculateCompleteness()
-
This method takes tableName and profiler as a parameter.
-
It calculates completeness profiler result data.
-
-
ProcessDataProfiler()
-
This method takes SourceDataStore and TargetDataStore bean as a request parameter.
-
It processes and generates profiler output.
-
It returns profiler result set count.
-
-
HandleMissingData ()
-
This method takes dataframe, dropNullValues and replaceNullValues as parameter.
-
It handles and replaces missing data.
-
Returns result set data frame of issue resolver.
-
-
HandleOutlierData ()
-
This Issue Resolver method takes dataframe and outlierData list as a paramter.
-
It handles outliers such as drop, mean, max and min etc.
-
It returns handled outlier data result dataframe.
-
-
HandleCaseSensitiveData ()
-
This method takes dataframe and caseSensitiveData as parameter.
-
It handles data with functions such as upper, proper, lower etc.
-
Returns result set data frame.
-
-
AnalyserandValidator
-
This method takes dataframe, constraints and table name as a request parameter.
-
It handles data with constraints such as Size, ApproxDistinctCount, MinLength, MaxLength, CountDistinct, Sum, Mean, StandardDiviation, Correlation, Completeness, Compliance, Uniqueness, Entropy, isLessThan, isGreaterThan etc.
-
Returns AnalyserAndValidator output.
-
Data Quality constraints
Based on the exact use case, data quality constraints or rules can be added. The supported constraints are as follows:
| ApproxCountDistinct | Returns the number of distinct values within the dataset. |
| Completeness | Checks whether the data fulfills the expectation of comprehensiveness. For example if customer name is asked, then whether first name and last name are present for all records. If either of the two is missing the record is incomplete. |
| Compliance | Calculates the fraction of rows that match the given column constraint. |
| Correlation | Calculates the pearson correlation coefficient between the selected columns. |
|
CountDistinct |
Returns the count of distinct elements in a column. |
| DataType | Returns the data type of the column. For example - boolean, fraction, integer and so on. |
| Distinctness | Returns the count of distinct values in a column. |
| Entropy |
Returns the measure of disorder contained in a message. |
| Maximum | Returns the maximum value of a numeric column. |
| MaxLength | Returns the maximum length of a column with string data type. |
| Mean | Returns the average value of a numeric column. |
| Minimum | Returns the minimum value of a numeric column. |
| MinLength | Returns the minimum length of a column with string data type. |
| MutualInformation | Information about one column that can be inferred from another column. This is applicable to numeric and string data types. |
| PatternMatch | Returns the regex pattern. |
| Size | Returns the size of data. |
| StandardDeviation | Shows the variation from the mean value of a column. |
| Sum | Provides the sum of the column values. |
| UniqueValueRatio | Returns the ratio of uniqueness of a column. This is applicable to numeric and string data types. |
| Uniqueness | Returns the ratio of unique values against all values of a column. This is applicable to numeric and string data types. |
| hasSize | Checks and confirms that the data has a size. |
| isComplete | Confirms whether a column is complete. |
| hasCompleteness | Confirms whether a column is complete based on the historical completeness of the column. |
| isUnique | Confirms whether a column is unique. |
| hasUniqueness | Confirms whether a column or set of columns have uniqueness. Uniqueness is a fraction of unique values of a column. |
| hasDistinctness | Confirms whether a column or set of columns have distinctness. Distinctness is a fraction of distinct values of a column. |
| hasUniqueValueRatio | Confirms whether there is a unique value ratio in a column or set of columns. |
| hasEntropy | Confirms whether a column has entropy. Entropy is a measure of disorder contained in a message. |
| hasMutualInformation | Confirms whether two columns have mutual information. Mutual information means how much information about one column can be inferred from another column. |
|
hasMinLength |
Confirms the minimum length of a column with string data type. |
| hasMaxLength | Confirms the maximum length of a column with string data type. |
| hasMin | Confirms the minimum of a column, that contains a long, integer, or float data type. |
| hasMax | Confirms the maximum of a column, that contains a long, integer, or float data type. |
| hasSum | Confirms the sum the column. |
| hasMean | Confirms the mean of the column. |
| hasStandardDeviation | Confirms that the column has variation from the mean value. |
| hasApproxcountDistinct | Confirms that the column has approximate distinct count. |
| hasCorrelation | Confirms that there exists a pearson correlation between two columns. |
| hasPattern | Confirms whether the pattern of values of a column match that of the regular expression. |
| containsCreditCardNumber | Checks and confirms whether a column has credit card number pattern. |
| containsEmail | Checks and confirms whether a column has email pattern. |
| containsURL | Checks and confirms whether a column has URL pattern. |
| containsSocialSecurityNumber | Checks and confirms whether a column has pattern for Social Security Number for the USA. |
| isNonNegative | Checks and confirms that a column does not contain any negative values. |
| isPositive | Checks and confirms that a column does not contain any negative value and is greater than 0. |
| isLessThan | Checks and confirms that in each row, the value of column A is greater than the value of column B. |
| isLessThanOrEqualTo | Checks and confirms that in each row, the value of column A is less than or equal to the value of column B. |
| isGreaterThan | Checks and confirms that in each row, the value of column A is greater than the value of column B. |
| isGreaterThanOrEqualTo | Checks and confirms that in each row, the value of column A is greater than or equal to the value of column B. |
| isContainedIn | Checks and confirms that the value in a column is contained in a set of predefined values. |
| What's next? Data Visualization Adapters |