Distinctness
Overview
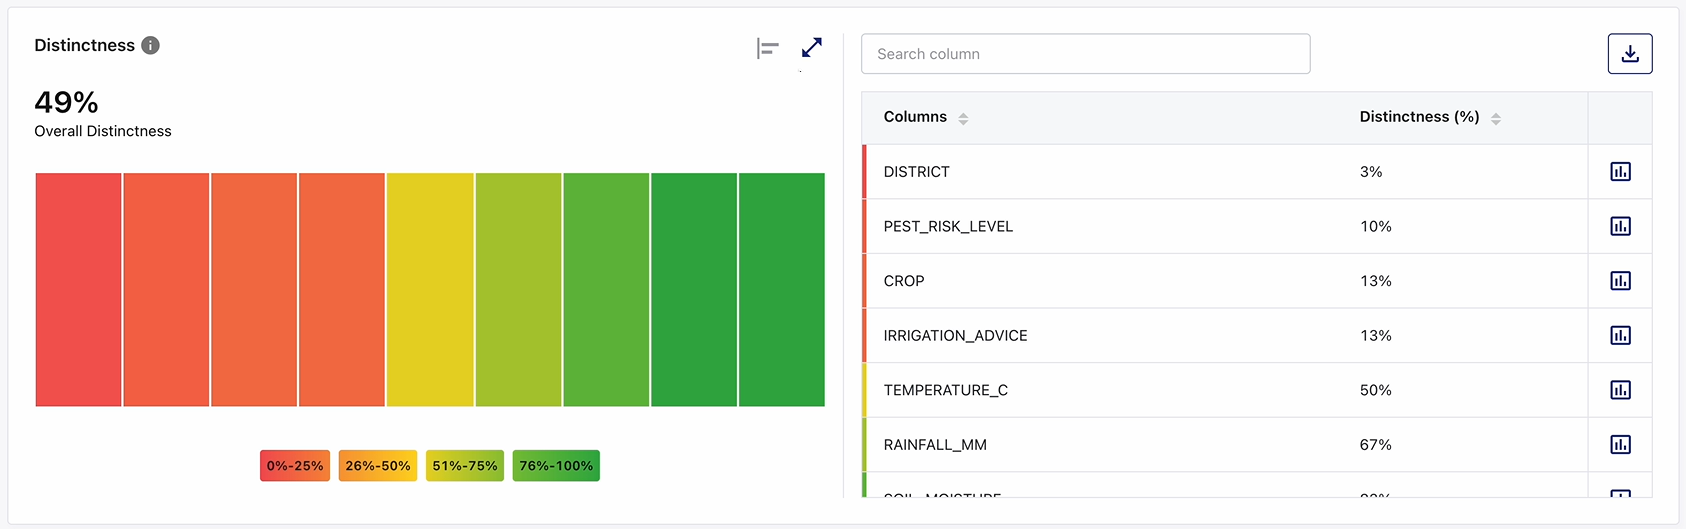
The Distinctness widget provides insight into how many unique values exist within each column of a dataset compared to the total number of records. It helps users identify columns that contain heavy duplicate data and columns that may not uniquely distinguish records.
This widget supports data profiling and data quality assessment by visualizing the percentage of distinct values present in each column. It enables users to quickly detect duplication patterns across the dataset without manually inspecting data values and supports identifying columns that may require deduplication, normalization, or further quality validation.
What the Widget Analyzes
Profiling dimension: Data distinctness
Level of analysis: Column-level with dataset-level aggregation
Calculation basis:
-
Distinctness percentage for a column is calculated as: (Number of distinct values / Total records) × 100
-
Overall Distinctness represents the aggregated distinctness across all columns in the dataset, derived from the individual column distinctness values.
What the Widget Shows
-
Distinctness percentage for each column in the dataset.
-
Visual representation of column distinctness using color-coded blocks.
-
A dataset-level Overall Distinctness score.
-
Threshold-based color indicators that highlight duplication risk levels.
-
Visual comparison of distinctness across columns using different chart views.
-
A supporting column list displaying exact distinctness percentages for every column.
How To Read This Widget
-
Each colored block within the visualization represents a single column in the dataset.
-
The color of each block reflects the Distinctness (%) value of that column.
-
Lower distinctness values indicate a higher level of duplicated values within a column.
-
Higher distinctness values indicate a larger proportion of unique values and greater differentiation between records.
-
Hovering over any visual element reveals a tooltip with the column name and exact distinctness percentage or value.
Available Views
The Distinctness widget supports multiple visualization formats in various chart or graph views on the left pane.
On the top right corner of the visualization pane, use the:
-
Chart or graph view icon to switch between available view types
-
Expand icon to visualize a larger view for detailed analysis.
-
Collapse icon to restore the widget to its default size.

Note:
Hover or click action on any chart/graph element reveals or highlights column-specific distinctness values. All interactions are read-only and do not alter the dataset.
|
View Type |
Description |
|---|---|
|
Area View |
This view displays distinctness values as connected points and filled areas to show relative variation across columns. Useful for scanning overall patterns. |
|
Bar View |
This view displays individual bars for each column, making it easy to compare distinctness percentages precisely. |
|
Summary (Overall) View |
This view displays a single Overall Distinctness (%) value representing the overall distinctness health of the dataset. |
Color Coding and Thresholds
Distinctness values are visually grouped into color bands to help users quickly identify columns with high or low distinctness.
|
Range |
Interpretation |
|---|---|
|
0% - 25% (Red) |
Very low distinctness, extremely high duplication |
|
26% - 50% (Orange) |
Low distinctness |
|
51% - 75% (Yellow) |
Moderate distinctness |
|
76% - 100% (Green) |
High distinctness, highly differentiated values |
Supporting Panes
The widget includes a distinctness tabular summary pane on the right, displayed alongside the visualization pane on the left, providing detailed column-level information.
It displays a list of all dataset Columns along with their Distinctness (%) values. The tabular information remains synchronized with the visualization.
Pane Interactions
-
Provide a column name in the Search column box to filter the table and quickly locate a specific column.
-
Click the download icon to export the result as PDF, CSV, or XLSX file. You can either download a consolidated file or individual widgets.
-
Download individual widgets to analyze specific visualizations in detail and gain deeper insights. Files are saved using a standard naming format by default, which you can rename locally after download:
<Data Profiler Results Widget name>_<Source Table name>.<pdf | csv | xlsx>
Example: Distinctness_bronzepatientvisitdetails.xlsx
-
For consolidated Excel downloads, each widget is exported to a separate worksheet. For example, three widgets are saved as three sheets within a single Excel file.
-
-
Click on the column headers to sort columns in ascending or descending order.
-
Click the chart icon for any column to open its distinctness (Distinctness details for current vs. last 5 runs) trend view. This helps users track changes in distinctness levels over time.
-
Scroll to access additional columns when the list exceeds the visible area.
Column Distinctness Trend Analysis
Selecting the chart icon for a column opens a detailed Distinctness history view.
This view enables you to:
-
Compare current Distinctness (%) values with previous profiler runs.
-
Monitor trends and changes in data duplication over time.
-
Detect sudden increases or decreases in distinctness that may indicate data quality issues.
-
Validate whether corrective actions have improved data quality across profiling executions.
The historical view is intended for analytical purposes and does not modify profiling results.
How to Interpret the Results
-
Columns with 0% distinctness contain very limited variation and consist primarily of repeated values.
-
Columns with low distinctness percentages generally represent categorical attributes, status fields, flags, or columns with heavy duplication.
-
Columns with high distinctness percentages contain a larger number of distinct values and provide stronger differentiation between records.
-
A low Overall Distinctness score suggests that many columns contain duplicated values and limited variation across the dataset.
-
A high Overall Distinctness score indicates that the dataset contains a healthy distribution of distinct values across columns.
When to Use This Widget
-
To identify columns that contain excessive duplicate values.
-
To understand the diversity of values, present within dataset columns.
-
To assess whether key analytical attributes contain sufficient variation.
-
To monitor distinctness trends across profiling runs.
-
To support data quality investigations related to duplication and value distribution.
-
To identify candidate columns that may require data cleansing, standardization, or deduplication activities.
 Recommended Topics |
What's next? Character Count |