Data Type Distribution
Overview
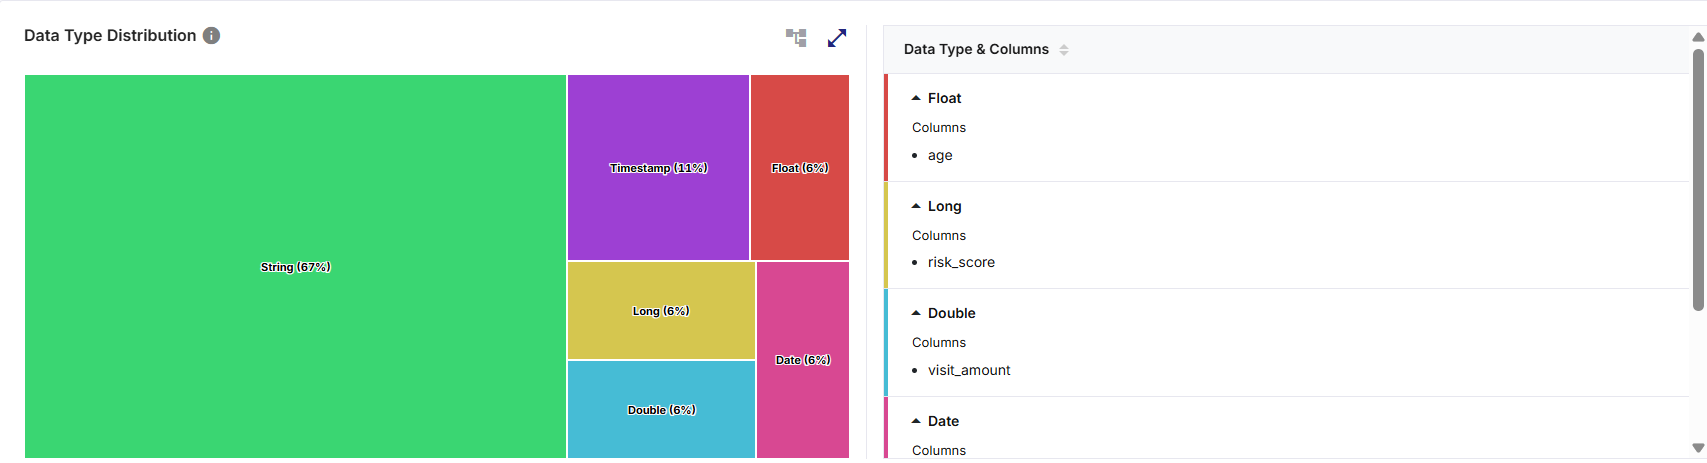
The Data Type Distribution widget provides a visual summary of how data types are distributed within a selected dataset and a high-level overview of how columns in that dataset are distributed across different data types. It helps users quickly understand the structural composition of the dataset by grouping columns based on their detected data types.
What the Widget Analyzes
-
Profiling dimension: Column data types
-
Level of analysis: Dataset-level, derived from column metadata
-
Calculation basis: Percentages are calculated based on the number of columns per data type. Additional indicators such as total number of columns or record-level values are also calculated wherever applicable.
What the Widget Shows
-
The distribution of dataset columns grouped by data type (for example, String, Integer etc.) and this widget also associates each data type with its corresponding list of columns.
-
The relative proportion of each detected data type based on the number of columns.
-
The total number of columns or record-level values based on applicable chart or graph views.
How to Read This Widget
-
Each visual segment (bar, slice, block, or point) represents a data type (String, Integer etc.)
-
The size, height, or area of the segment indicates the percentage of columns belonging to that data type.
-
Labels and legends identify data types and their corresponding values.
-
Percentages represent the relative share of columns, not individual records.
Available Views
The widget supports multiple visualization formats in various chart or graph views on the left pane. On the top right corner of the visualization pane, use the:
-
Chart or graph view icon to switch between available view types
-
Expand icon to visualize a larger view for detailed analysis
-
Collapse icon to icon to restore the widget to its default size

Note:
Hover or click actions on any chart/graph element reveals or highlights additional contextual information, depending on the view. All interactions are read-only and do not alter the dataset.
| View Type | Description |
|---|---|
|
Area View |
This view displays filled areas to represent proportional differences between data types. |
|
Bar View |
This view displays horizontal bars side by side to show the range of percentage share of each data type. |
|
Column View |
This view displays vertical bars to represent each data type and its proportion. |
|
Donut View |
This view displays slices of a circle with a hollow center to show the percentage share and value of each data type. |
|
Line View |
This view displays a line that connects data type values to show relative variation. |
|
Pie View |
This view displays slices of a circle to show the percentage share and value of each data type. |
|
Tree (Treemap) View |
This view displays proportional blocks to represent the relative dominance of each data type. |
When to Use Each View
-
Use Tree view for proportional dominance
-
Use Bar or Column views for quick comparison in horizontal or vertical view
-
Use Pie or Donut views for percentage composition analysis with reduced visual clutter
-
Use Line or Area views for simplified visual scanning or trend-style minimalist comparison where exact values are less important
Supporting Panes
The widget includes a Data Type & Columns pane that is always visible alongside the visualization pane, providing detailed column-level context. It lists all detected data types with the corresponding column names under each data type.
Click the download icon to export the result as PDF, CSV, or XLSX file. You can either download a consolidated file or individual widgets.
-
Download individual widgets to analyze specific visualizations in detail and gain deeper insights. Files are saved using a standard naming format by default, which you can rename locally after download:
<Data Profiler Results Widget name>_<Source Table name>.<pdf | csv | xlsx>
Example: DataTypeDistribution_bronzepatientvisitdetails.csv
-
For consolidated Excel downloads, each widget is exported to a separate worksheet. For example, three widgets are saved as three sheets within a single Excel file.
Note:
-
Clicking on the Data Type & Columns pane rearranges the data types in an ascending or descending order.
-
Clicking on a data type segment either expands the view to display the list of associated columns or collapses the column view. Expanded views help users validate schema design and column categorization.
-
Scrolling allows access to additional data types or columns when the list exceeds visible space.
How to Interpret the Results
-
Higher percentage for a data type indicates more columns of that type in the dataset.
-
Dominance of String data types may suggest descriptive or categorical data.
-
Higher proportion of numeric data types (Integer, Decimal) may indicate analytical or metric-driven datasets.
When to Use this Widget
-
To quickly understand the structural makeup of a dataset.
-
To identify unexpected or imbalanced data type distributions and datasets with excessive string columns that may need normalization.
-
To spot unexpected data type assignments (for example, numeric values stored as strings).
-
To validate schema design after ingestion or transformation and schema consistency across datasets.
 Recommended Topics |
What's next? Data Distribution |