Data Profiling of Existing Data
Overview
Data Profiling enables you to analyze the structural, statistical, and quality characteristics of datasets available in the Calibo Accelerate platform. It helps you understand data completeness, consistency, distribution, and validity by generating profiling metrics at column and table levels.
Using Data Profiling, you can:
-
Explore datasets across supported platforms
-
Configure and run profiling jobs on selected tables and columns
-
Apply standard quality constraints
-
Sample data for faster analysis
-
View profiling results in a consolidated, visual format
-
Re run, edit, or manage existing profiling jobs
Data Profiling is available as a platform level feature and can be executed independently of data pipelines.
High Level Workflow
The Data Profiling workflow follows these steps:
 1. Access Data Profiling
This section allows you to begin exploring and managing all profiler jobs created within the Calibo Accelerate platform. From the Data Lab menu, you can quickly navigate to the Data Profiling page, where existing jobs, their statuses, and available actions are conveniently displayed in one place.
To access data profiling:
-
Sign in to the Calibo Accelerate platform.
-
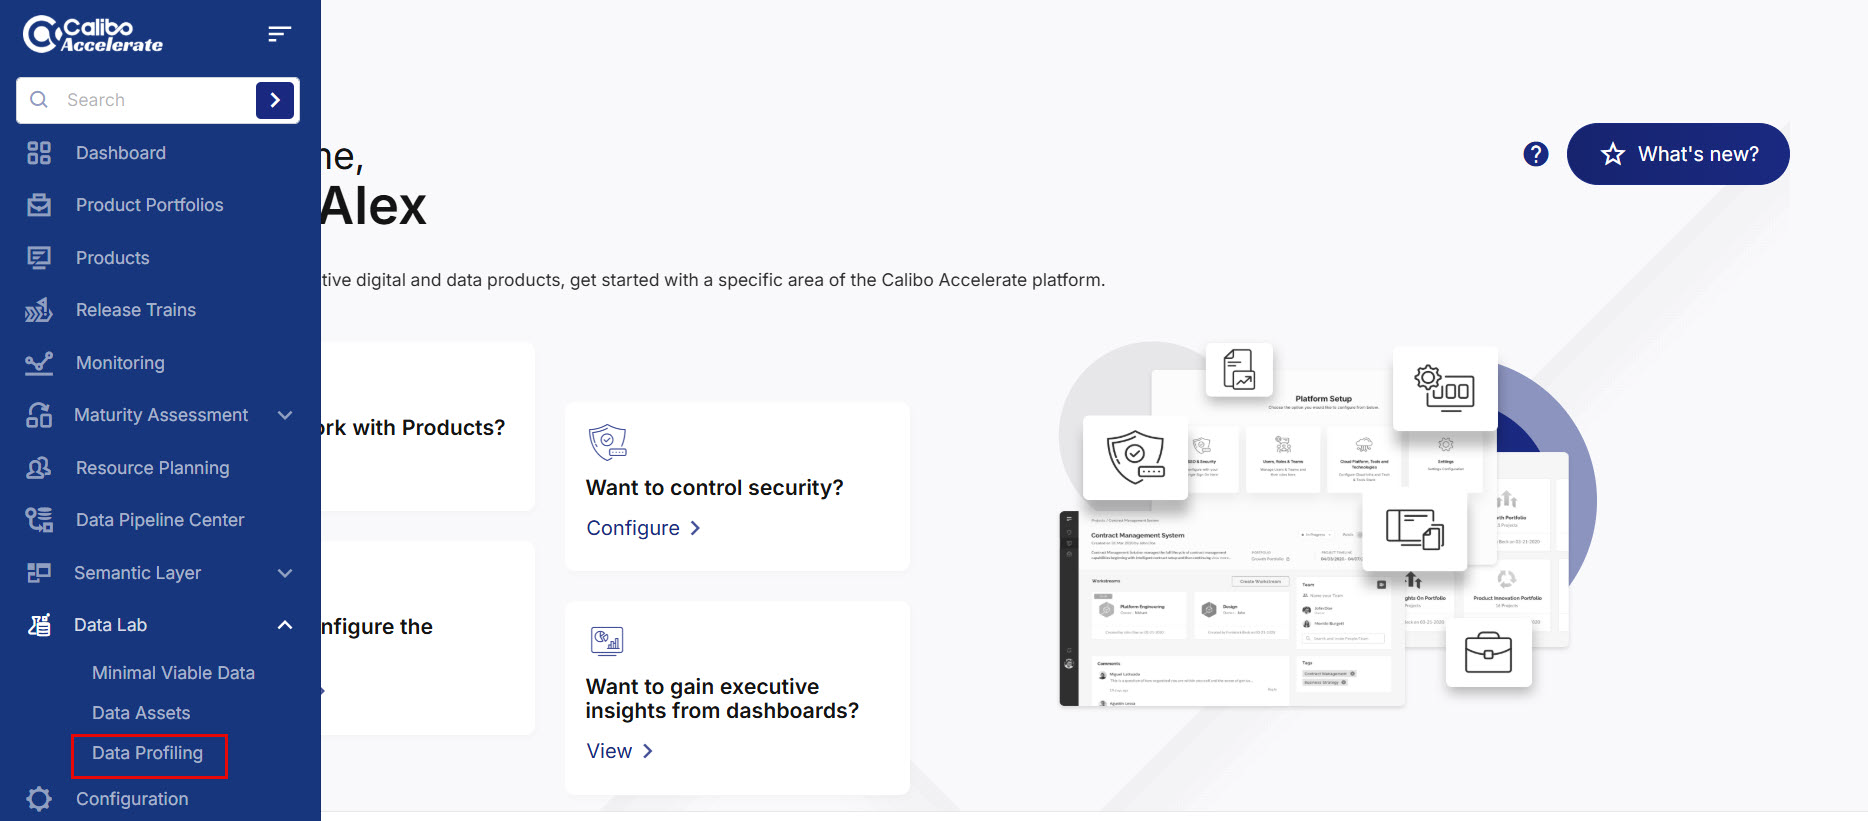
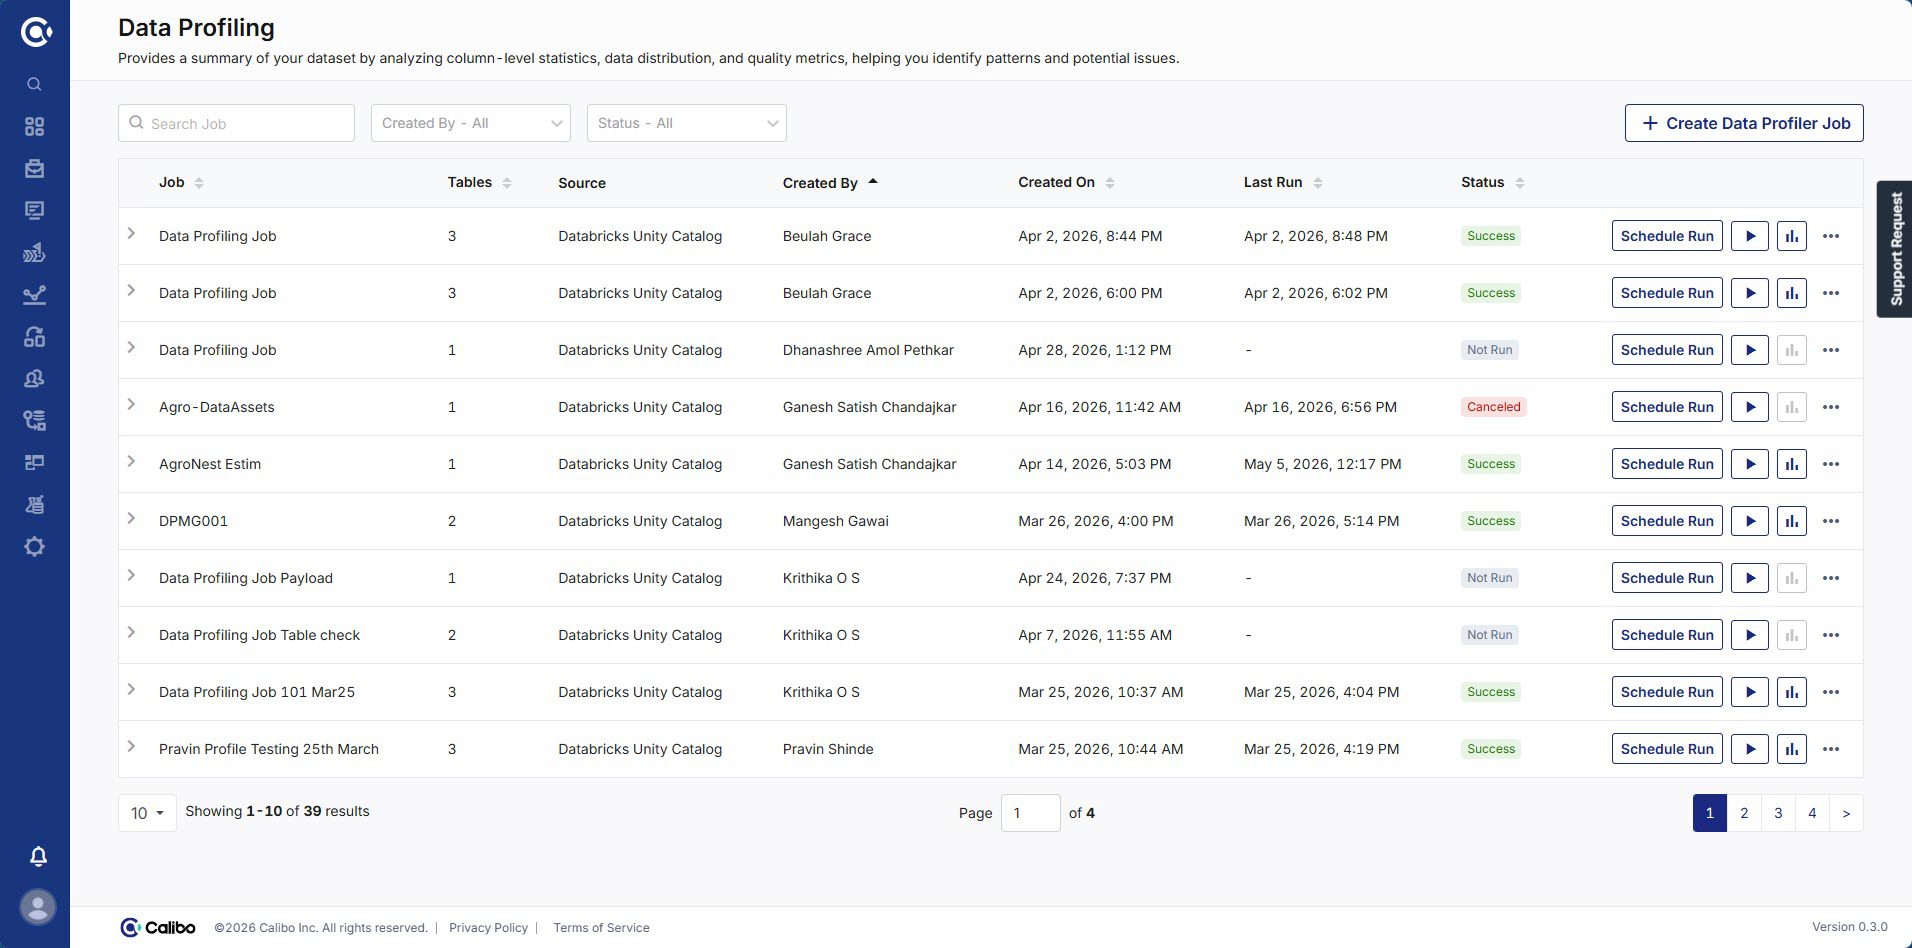
From the left navigation menu, navigate to Data Lab > Data Profiling. The Data Profiling page displays a list of the existing profiler jobs and their available actions.
2. Create a Data Profiling Job
This section allows you to define a new profiler with customized settings for data selection, configuration, and profiling behavior. This guided process walks you through entering job details, selecting resources, adding tables, and configuring profiling options so you can generate meaningful insights from your datasets.
To create a data profiling job:
-
On the top right corner of the Data Profiling page, click + Create Data Profiler Job. The Create Data Profiler Job side drawer opens.
-
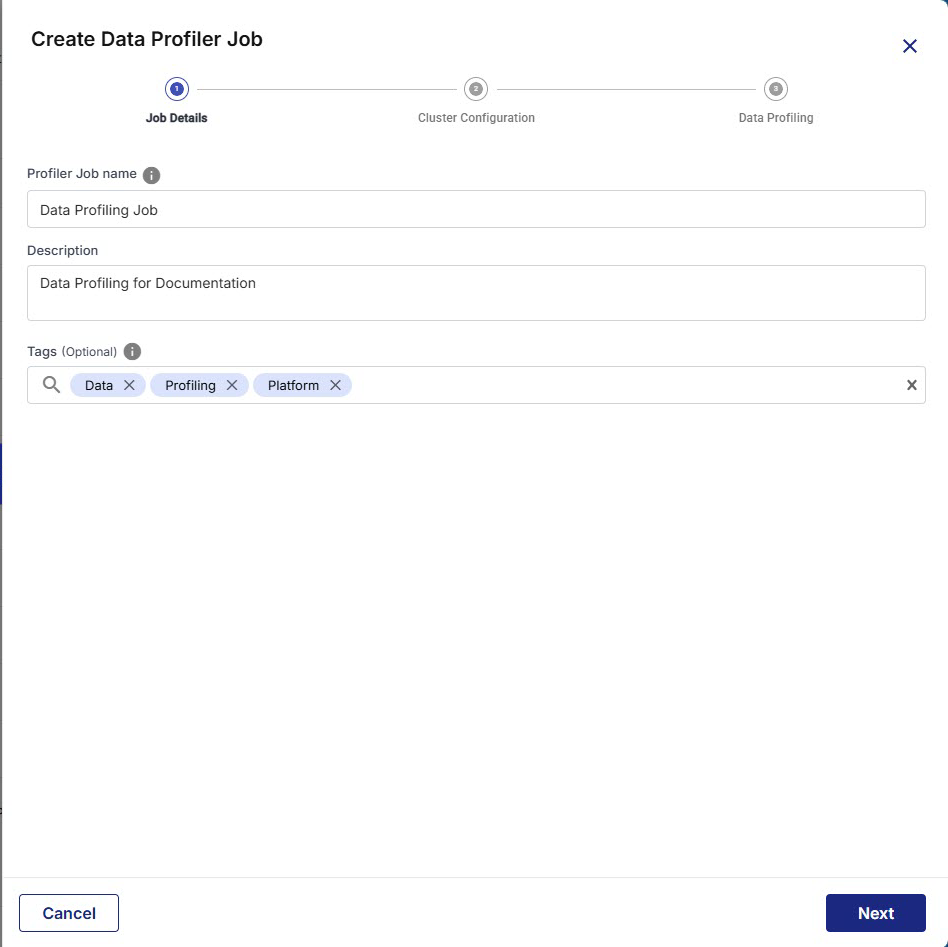
In the Job Details step, provide the following details:
-
Profiler Job Name - Unique name to identify the profiling job
-
Description - The description of the profiling purpose
-
Tags (Optional) - Select the predefined tags from the dropdown or add custom tags to organize your job.
-
Click Next.
-
-
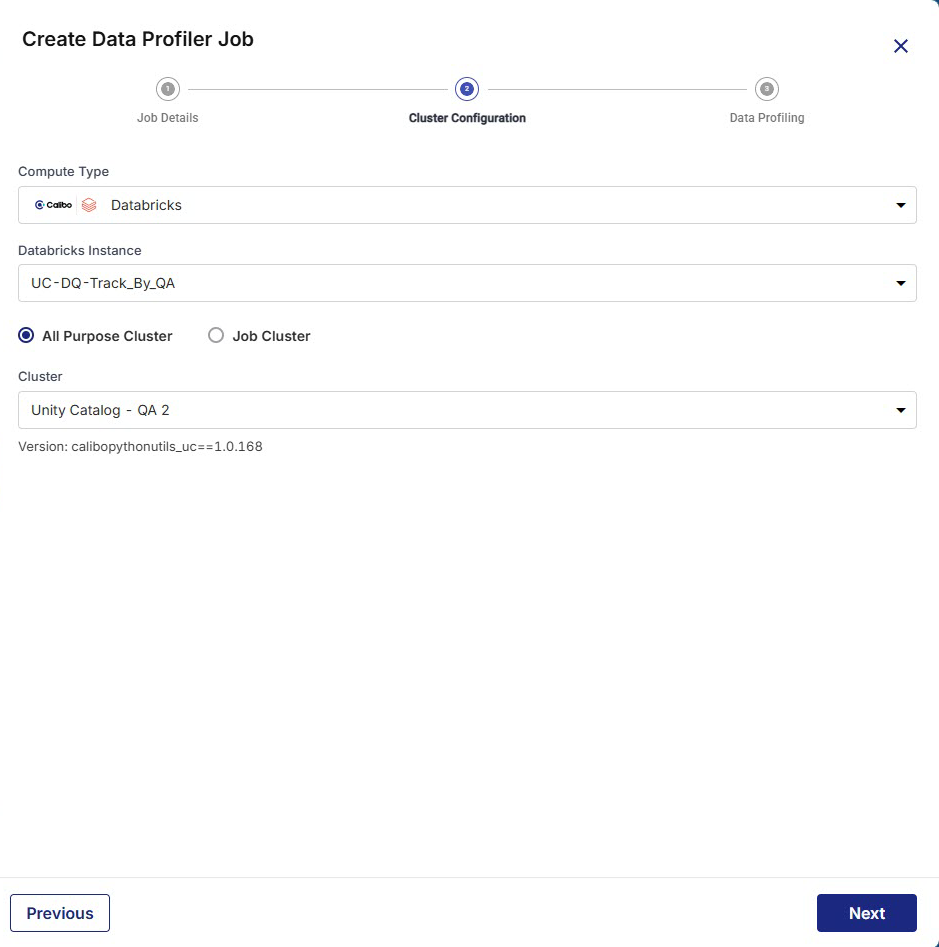
In the Cluster Configuration step, provide the following details:
-
Compute Type - Select the type of compute from the dropdown.
-
Databricks Instance - Select the Databricks instance from the dropdown.
-
All Purpose Cluster - Select Cluster from the dropdown.

Note:
You can select an all-purpose cluster or a job cluster to run the configured job. In case your Databricks cluster is not created through the Calibo Accelerate platform and you want to update custom environment variables, see How to update custom environment variables for a Databricks cluster that is not created through the Calibo Accelerate platform. If you do not see a cluster configuration in the dropdown list, it is possible that the configured Databricks cluster has been deleted. In this case, you must create a new cluster and update the job configuration with the new cluster to ensure the job runs successfully.
-
Job Cluster - Select Policy from the dropdown and provide the following details as needed:
Cluster Details Description Choose Cluster Provide a name for the job cluster that you want to create. Job Configuration Name Provide a name for the job cluster configuration. Databricks Runtime Version Select the appropriate Databricks version. Worker Type Select the worker type for the job cluster. Workers Enter the number of workers to be used for running the job in the job cluster. You can either have a fixed number of workers or you can choose autoscaling. Enable Autoscaling Autoscaling helps in scaling up or down the number of workers within the range specified by you. This helps in reallocating workers to a job during its compute-intensive phase. Once the compute requirement reduces the excess number of workers are removed. This helps control your resource costs. Cloud Infrastructure Details First on Demand Provide the number of cluster nodes that are marked as first_on_demand. The first_on_demand nodes of the cluster are placed on on-demand instances. Availability Choose the type of EC2 instances to launch your Apache Spark clusters, from the following options:
-
Spot
-
On-demand
-
Spot with fallback
Zone Identifier of the availability zone or data center in which the cluster resides. The provided availability zone must be in the same region as the Databricks deployment. Instance Profile ARN Provide an instance profile ARN that can access the target Amazon S3 bucket. EBS Volume Type The type of EBS volume that is launched with this cluster. EBS Volume Count The number of volumes launched for each instance of the cluster. EBS Volume Size The size of the EBS volume to be used for the cluster. Additional Details Spark Config To fine tune Spark jobs, provide custom Spark configuration properties in key value pairs. Environment Variables Configure custom environment variables that you can use in init scripts. Logging Path (DBFS Only) Provide the logging path to deliver the logs for the Spark jobs. Init Scripts Provide the init or initialization scripts that run during the startup of each cluster. -
-
Click Next.
-
-
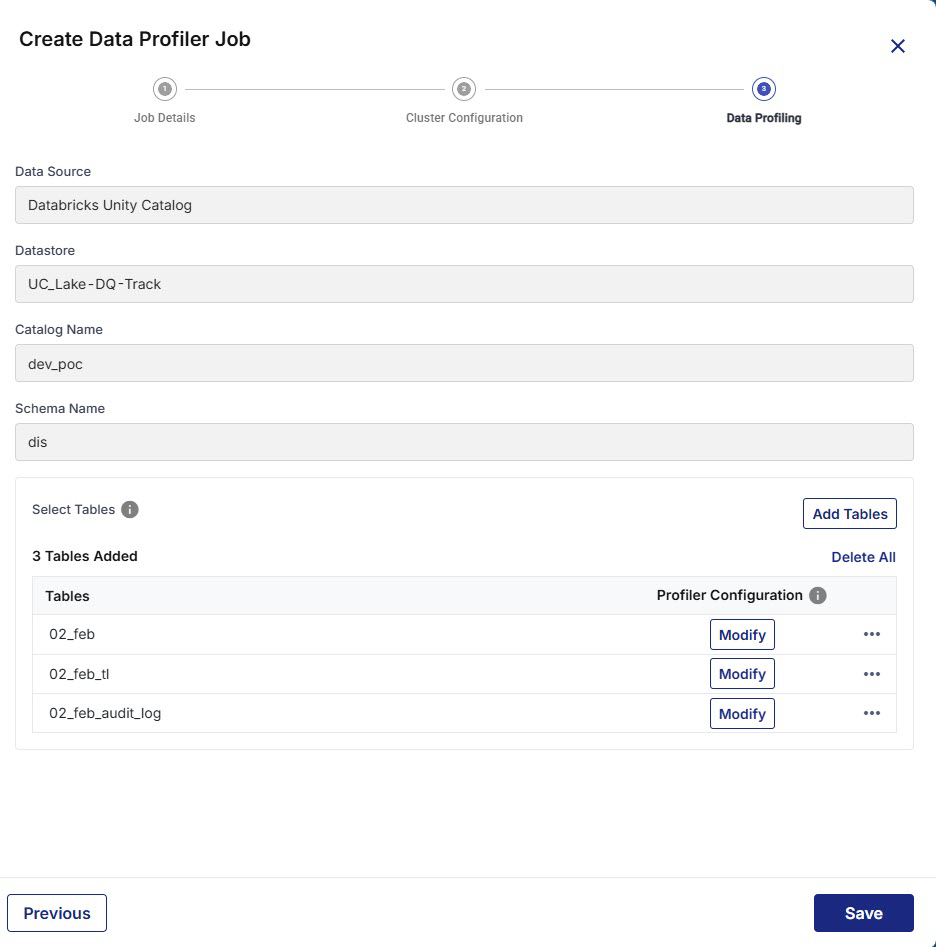
In the Data Profiling step, provide the following details:
-
Data Source - This field is automatically populated, depending on the data source node configured and added in the pipeline.
-
Datastore - This field is automatically populated, depending on the target node configured and added in the pipeline.
-
Catalog Name - This field is automatically populated, depending on the catalog selected for the selected Unity Catalog.
-
Schema Name - Select the schema from the dropdown list.
-
Click Add Tables to select one or more tables as needed. The added tables display in the Select Tables section.
Note:
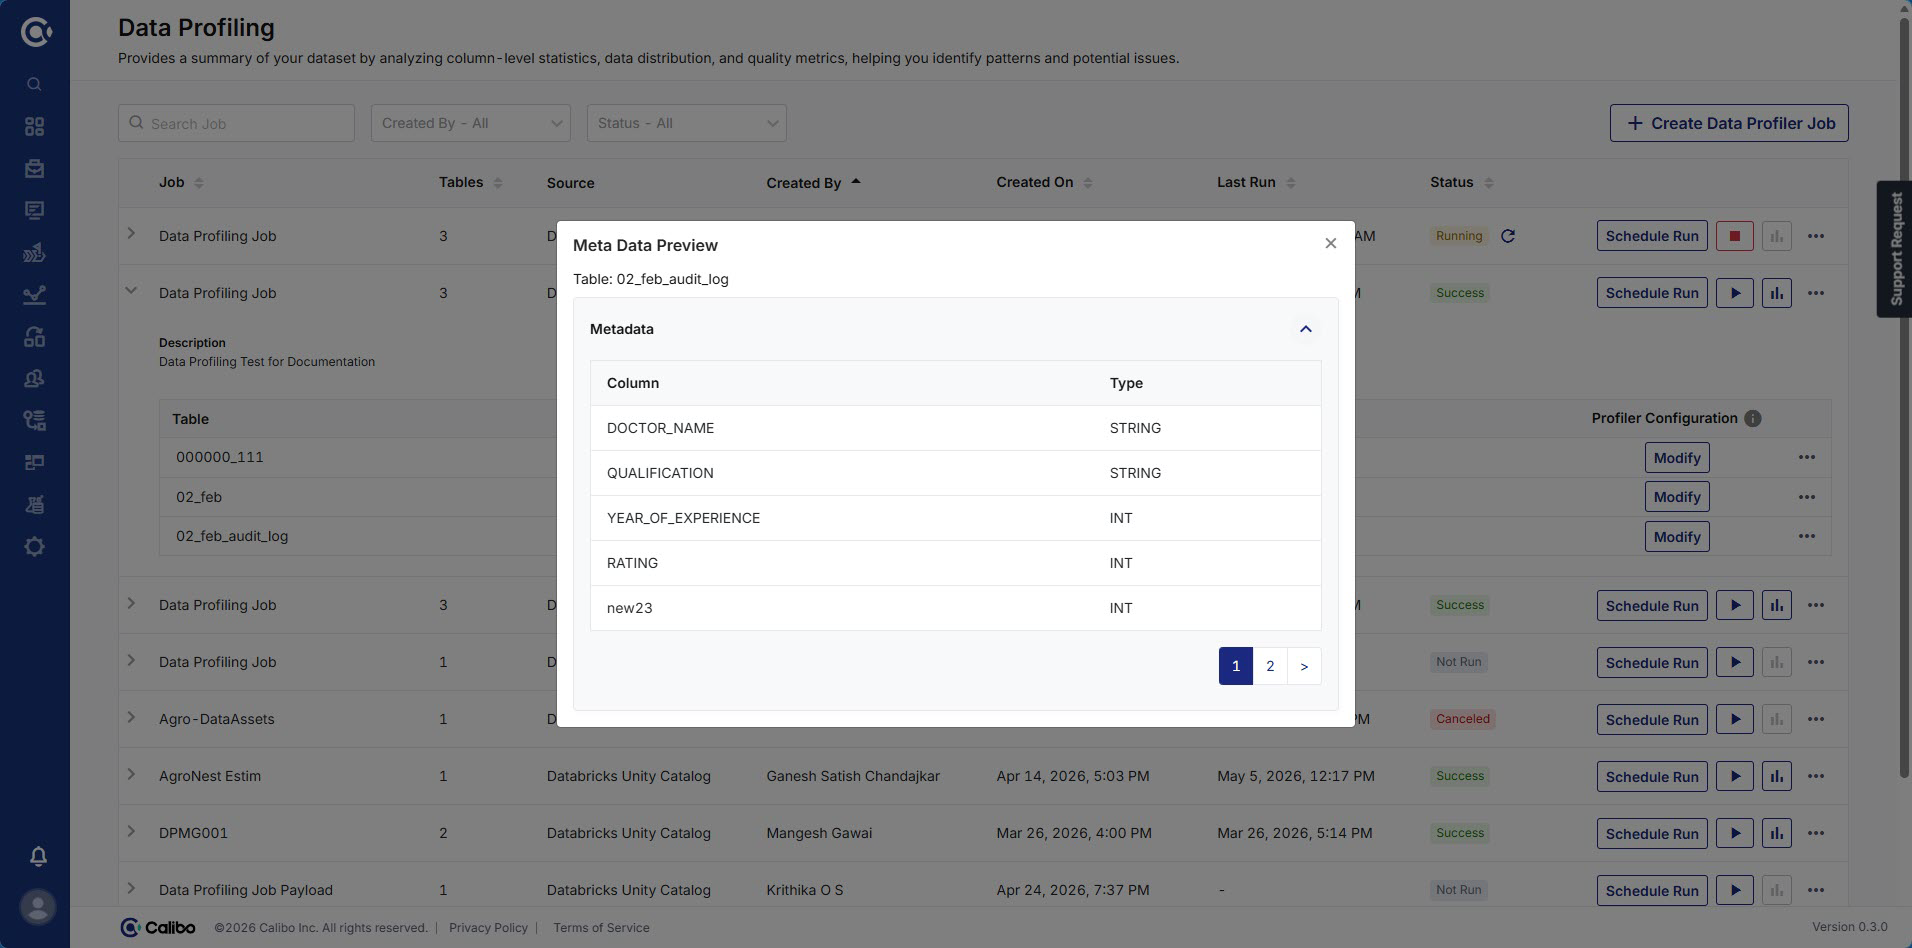
Use the Delete All option to delete all the added tables or you can delete a specific table using the Delete option from the ellipses of each table. If you want to modify Profiler Configuration for a table, use the Modify option next to each table and update the default profiler settings. For more information, see Modifying a Profiler Job. From the ellipses (…), click Sample Data Preview or Meta Data Preview next to each table to view a sample or meta data of that table respectively.
-
-
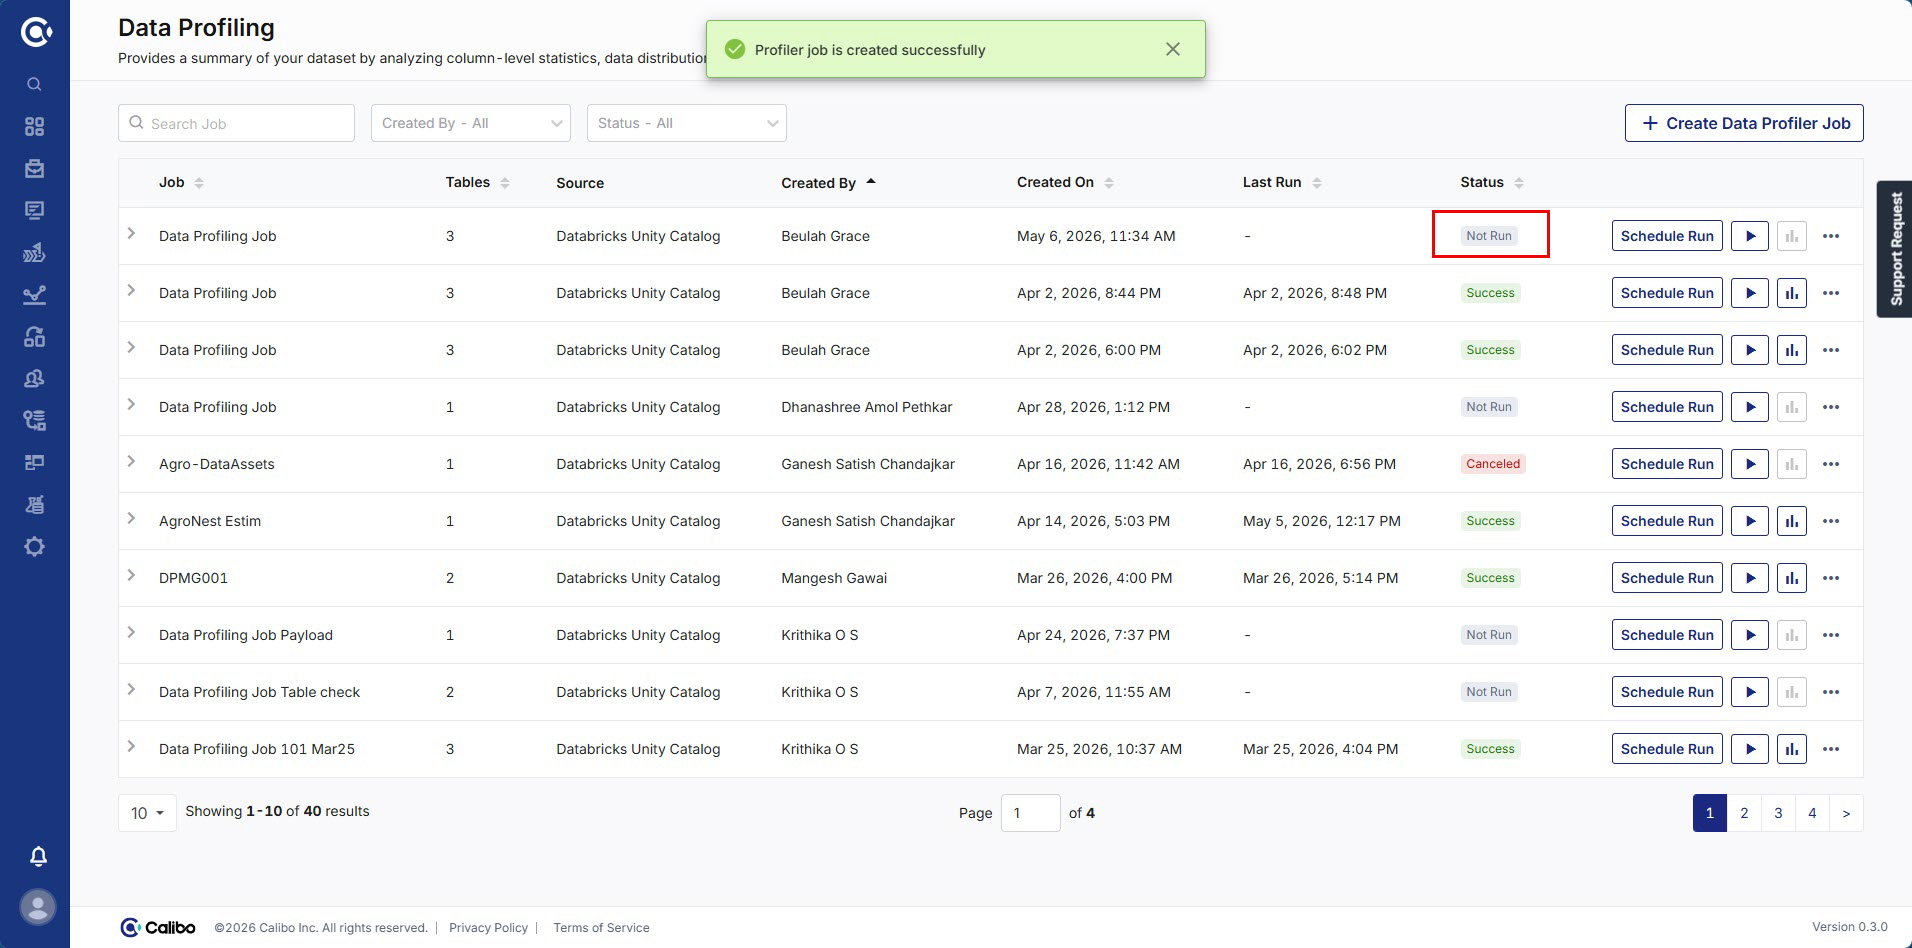
Click Save. The data profiler job is created and displayed on the Data Profiling page. The job run Status is displayed as Not Run by default.
3. Run the Profiler Job
This section allows you to initiate the actual profiling process based on your configured settings. From the job listing, you can trigger execution, monitor run status in real time, and optionally schedule recurring runs to maintain up to date profiling insights.
To run the profiler job:
-
On the Data Profiling page, search for your data profiler job from the available list.
Note:
You can filter the jobs by status and created users.
-
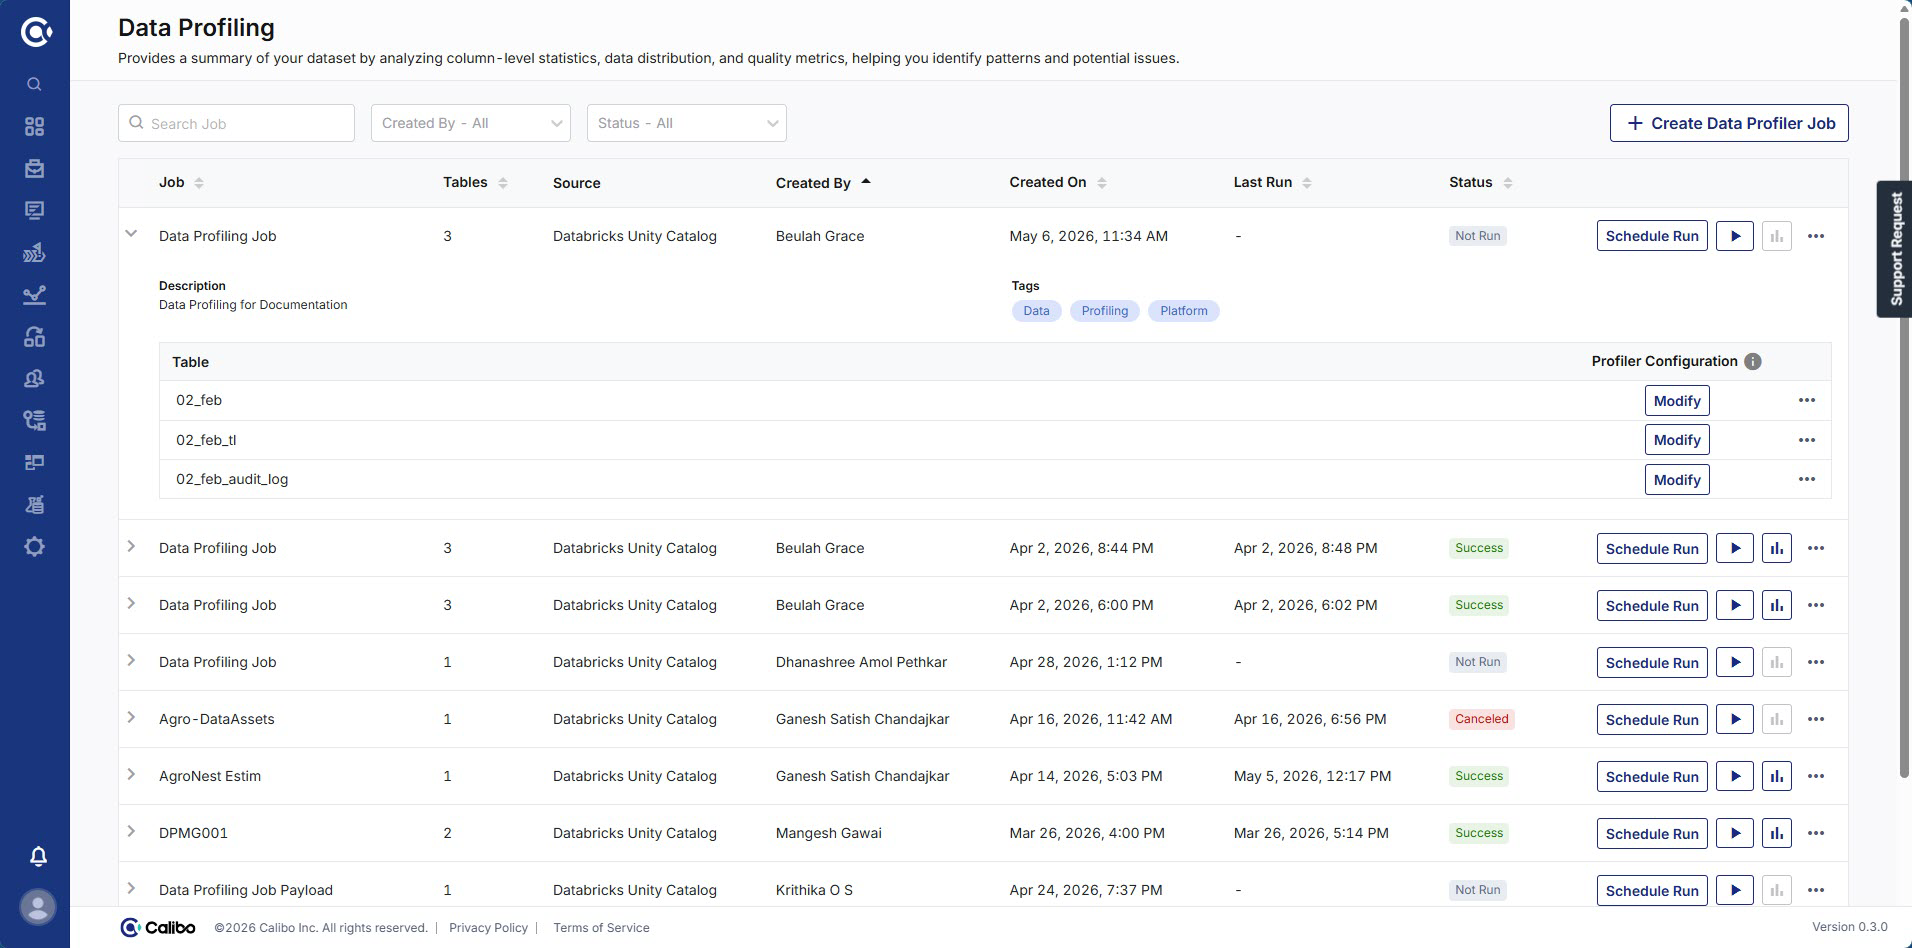
For the selected data profiler job, click the expand icon
 to review the job configuration summary.
-
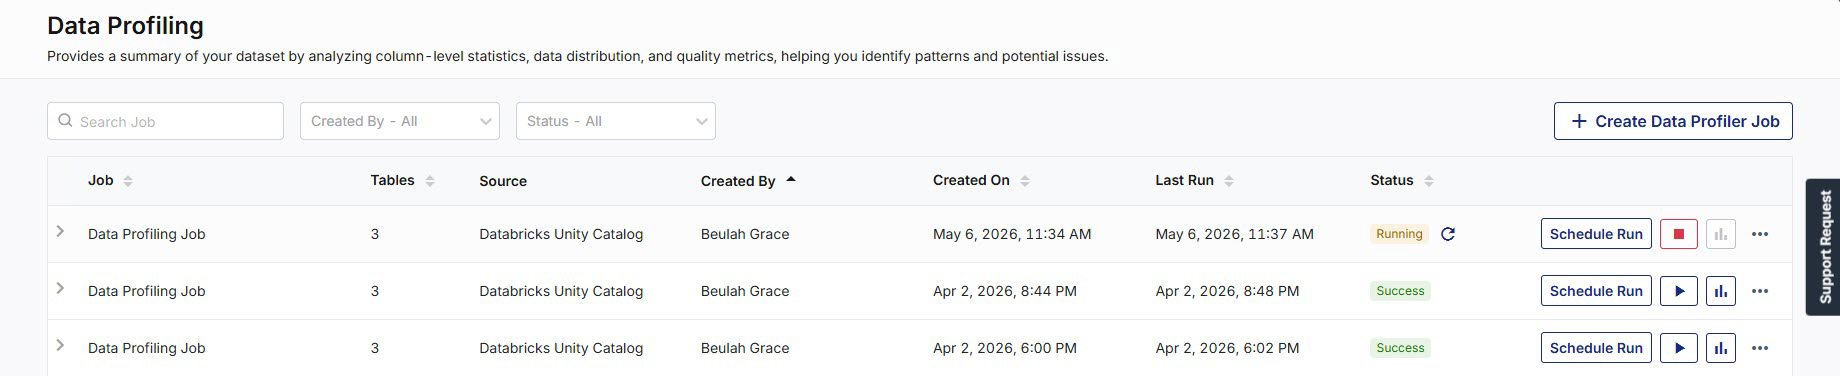
Click Run to start the profiler job. The job status is displayed as Running, Success, or Failed based on the execution status.
Note:
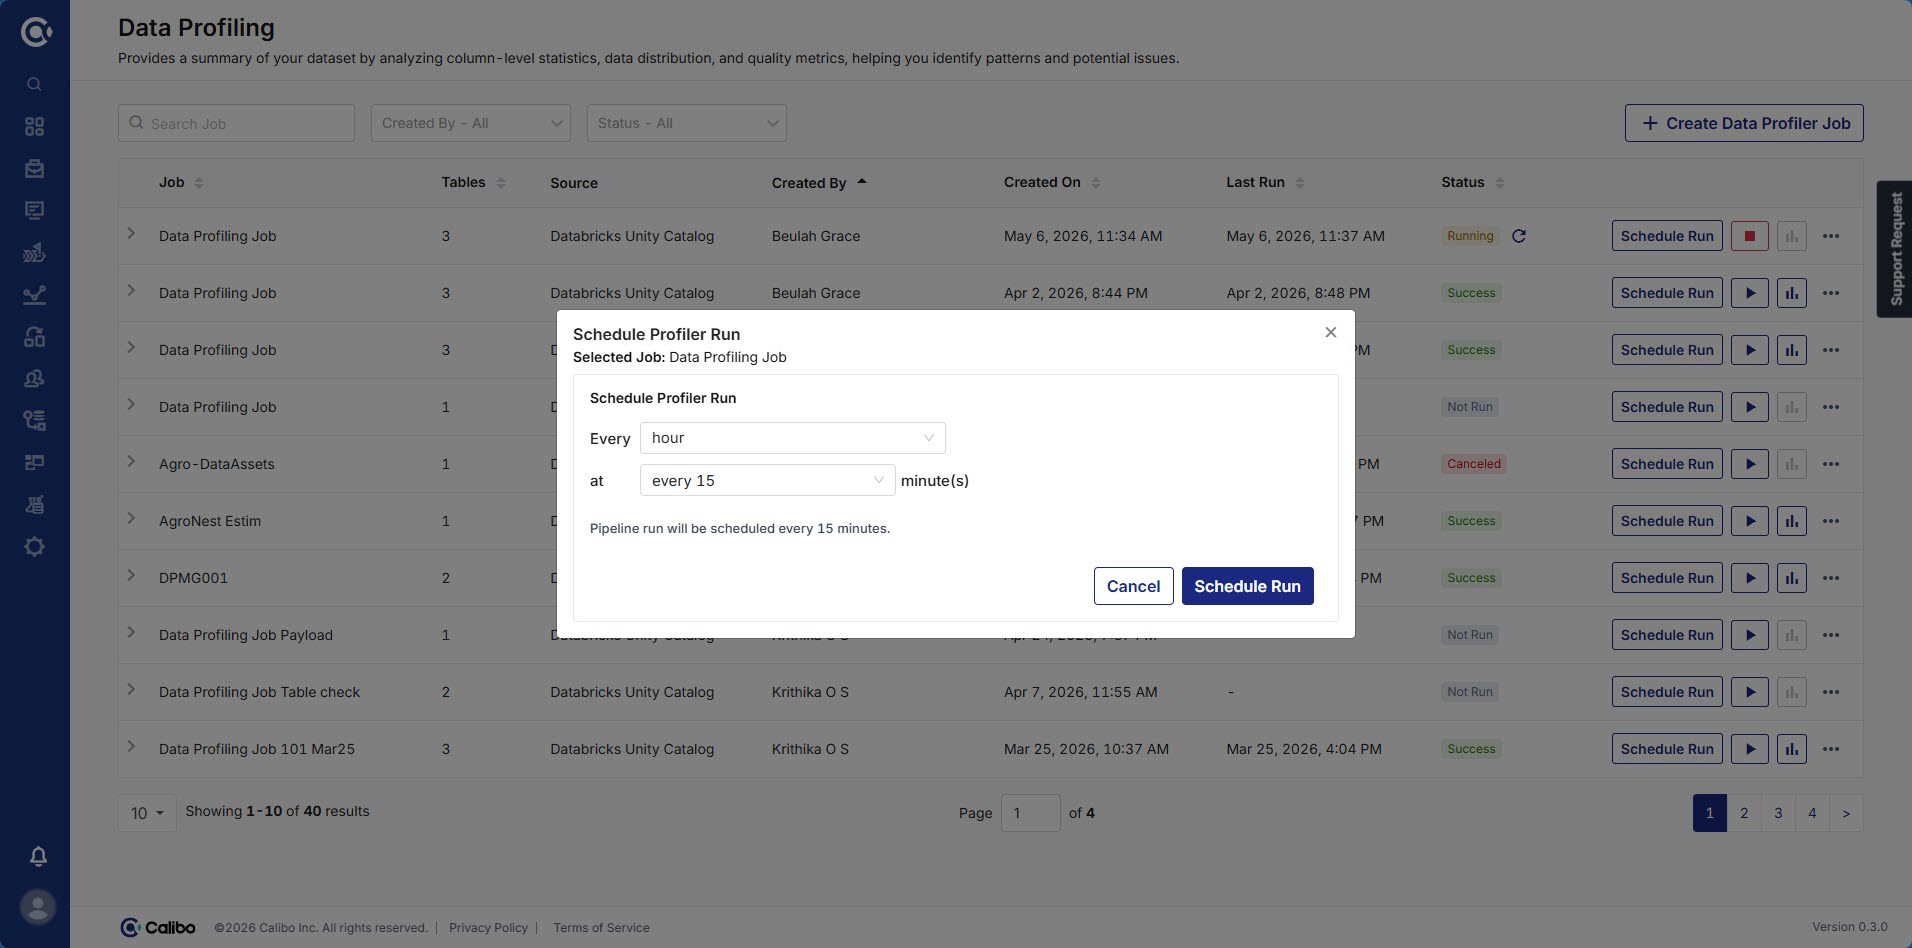
To stop or refresh the profiler job run, use the pause or refresh option respectively. Click Schedule Run to set a defined time intervals for running the data profiler job.
4. View Profiling Results
This section gives you access to detailed metrics generated by the profiling job, including table level and column level statistics. This view consolidates quality indicators such as completeness, distinct counts, validity checks, and summary statistics, helping you quickly assess the condition of your data.
To view profiling results:
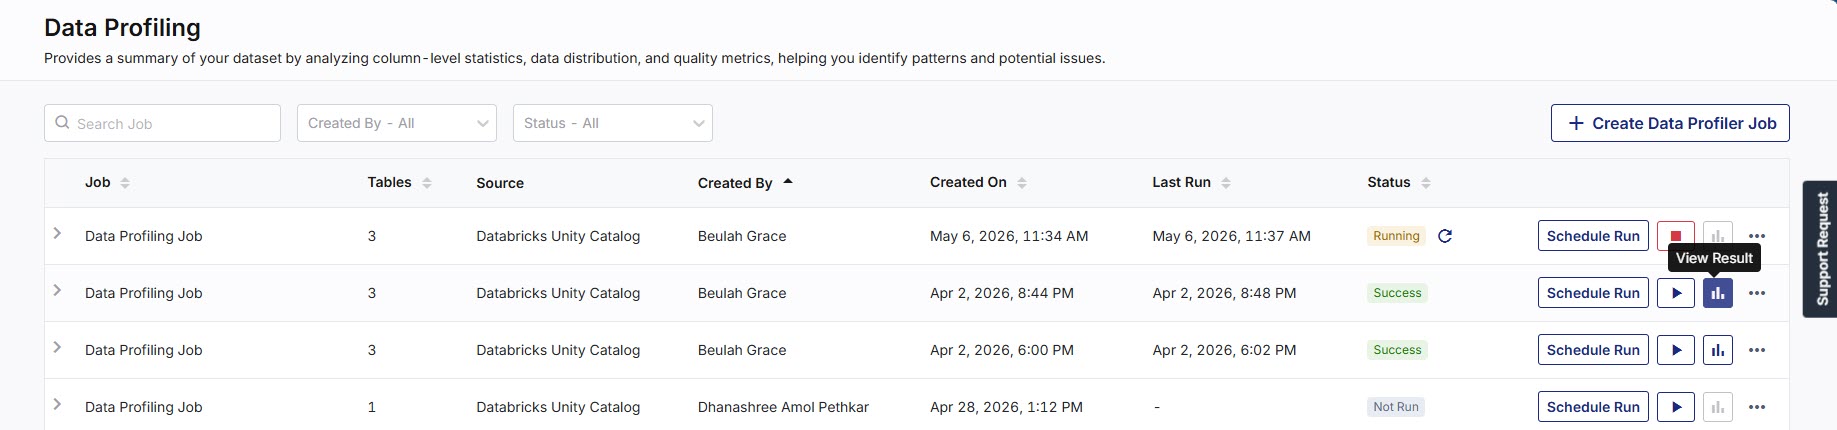
After successful data profiling execution, click View Result to view the data profiling results on the Profiling Result page.
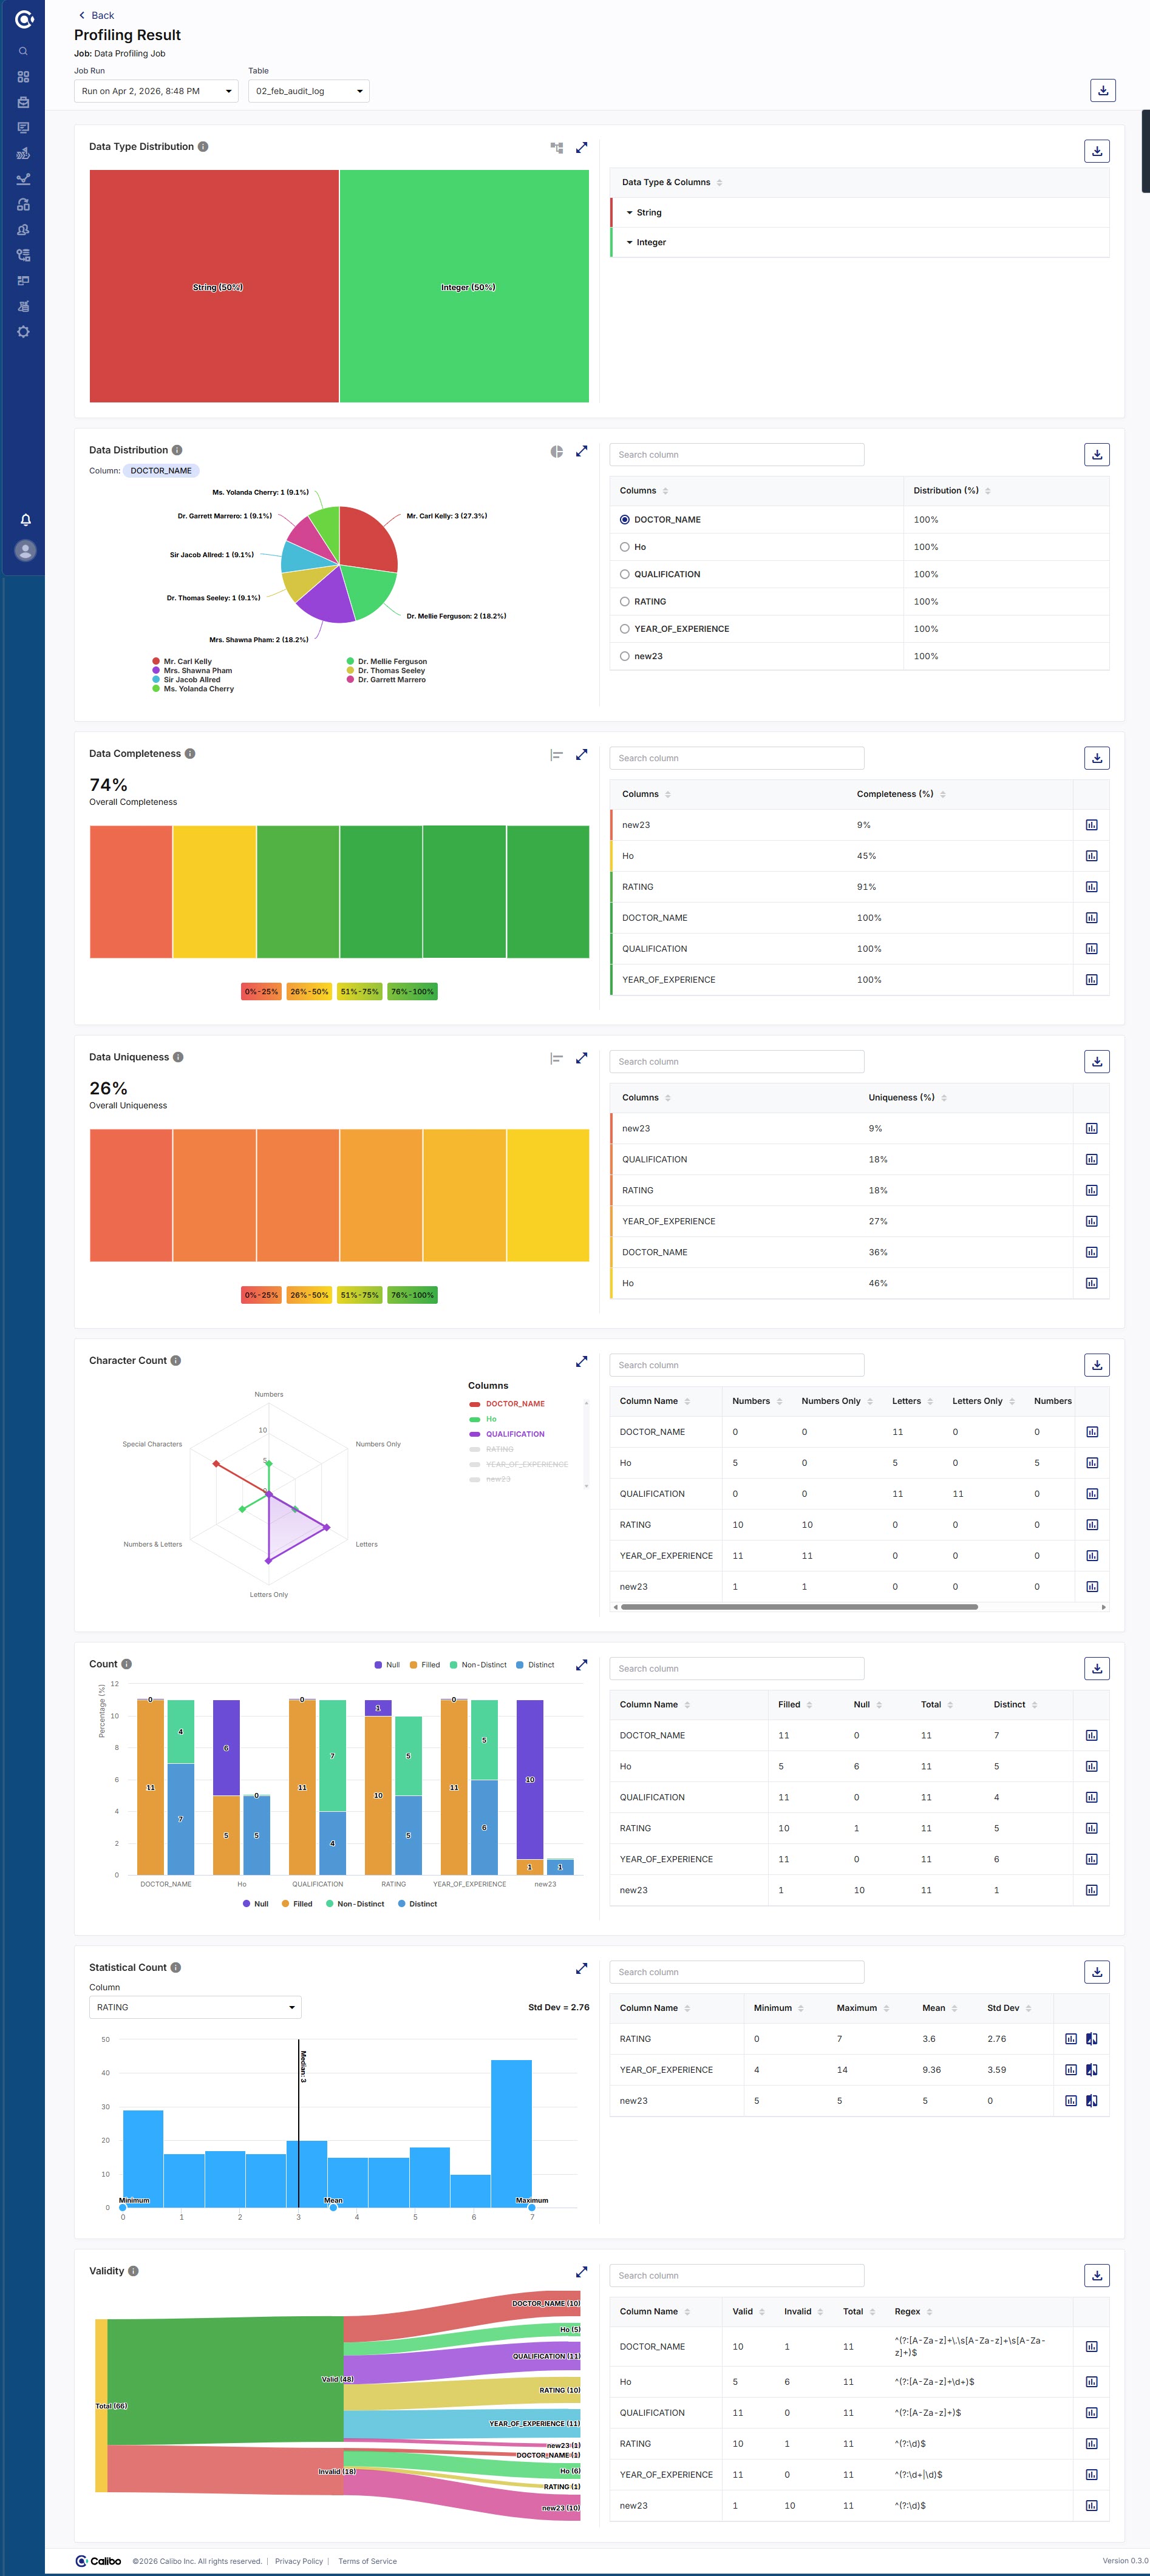
The data profiling results include job run details, table level metrics, and column level metrics. The results are stored in the configured statistics table and displayed in a tabular and visual formats. For more information, see Data Profiler Dashboards.
5. Manage Existing Data Profiler Jobs
This section allows you to maintain, update, or remove profiler jobs as your data or analysis needs evolve. From the job list, you can edit configurations, review settings, delete unused jobs, or access related Databricks details to ensure your profiling workflows stay up to date.
To manage an existing data profiler job:
-
On the Data Profiling page, search for the data profiler job you want to edit.
-
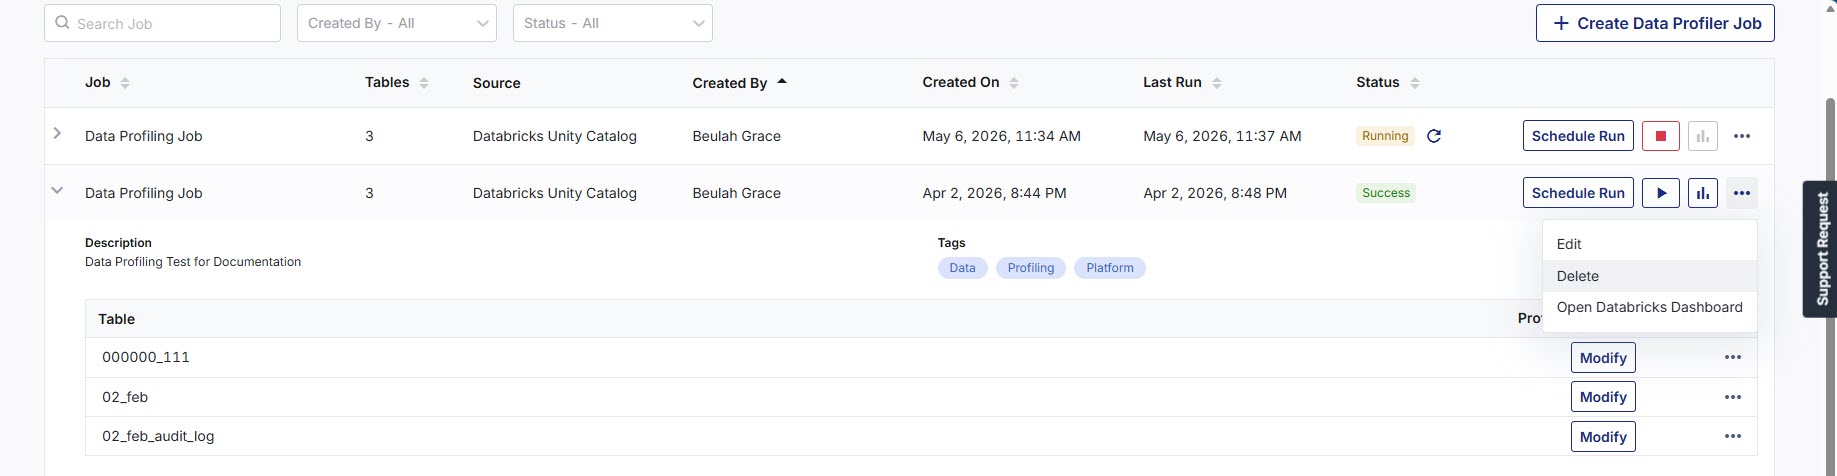
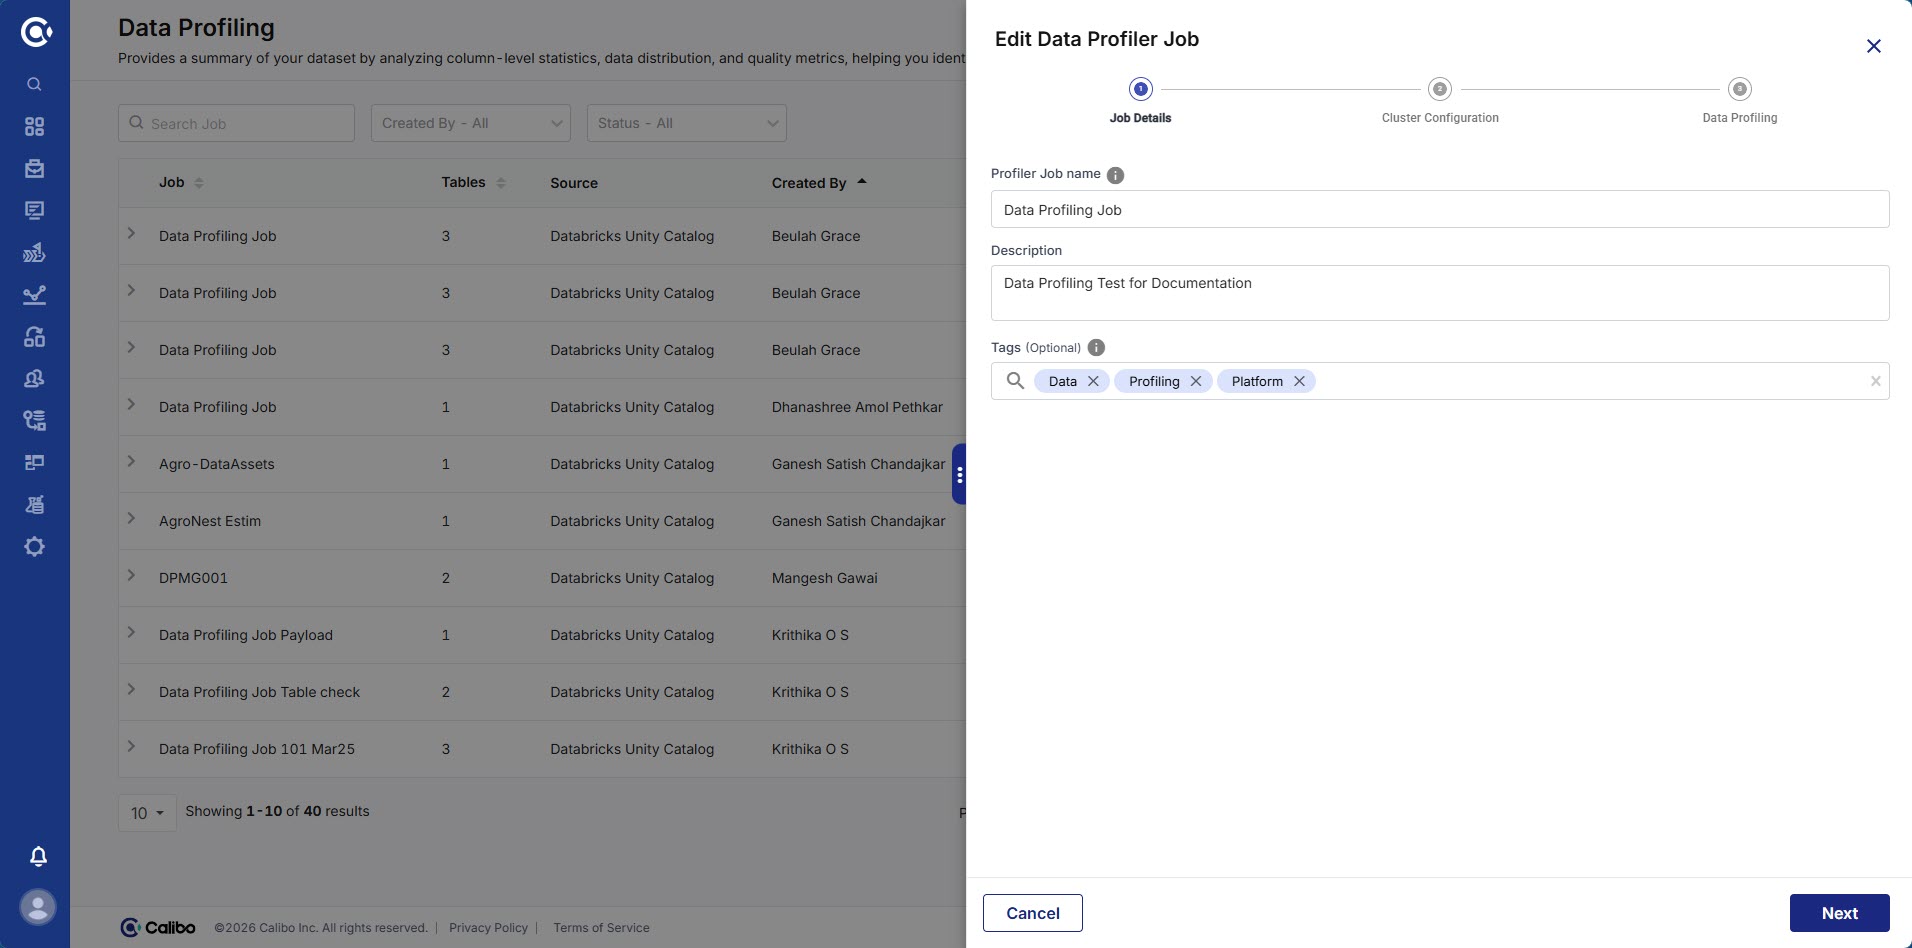
From the ellipses (…), click Edit. The Edit Data Profiler Job side drawer opens.
Note:
To delete the job, use the Delete option. Click Open Databricks Dashboard to view Databricks configuration details on its dashboard.
-
Edit the profiler configuration details in the Job Details, Cluster Configuration, or Data Profiling steps as needed, then click Save.
Note:
You can re-run the job to execute the data profiling on the updated data and generate updated results.
6. Modify a Profiler Job
This section provides you flexibility to adjust profiling settings for specific tables within an existing job. You can update column selections, constraints, regular expressions, and sampling options, ensuring the profiler continues to reflect your latest data quality requirements.
To modify a profiler job:
-
On the Data Profiling page, search for the data profiler job you want to modify.
-
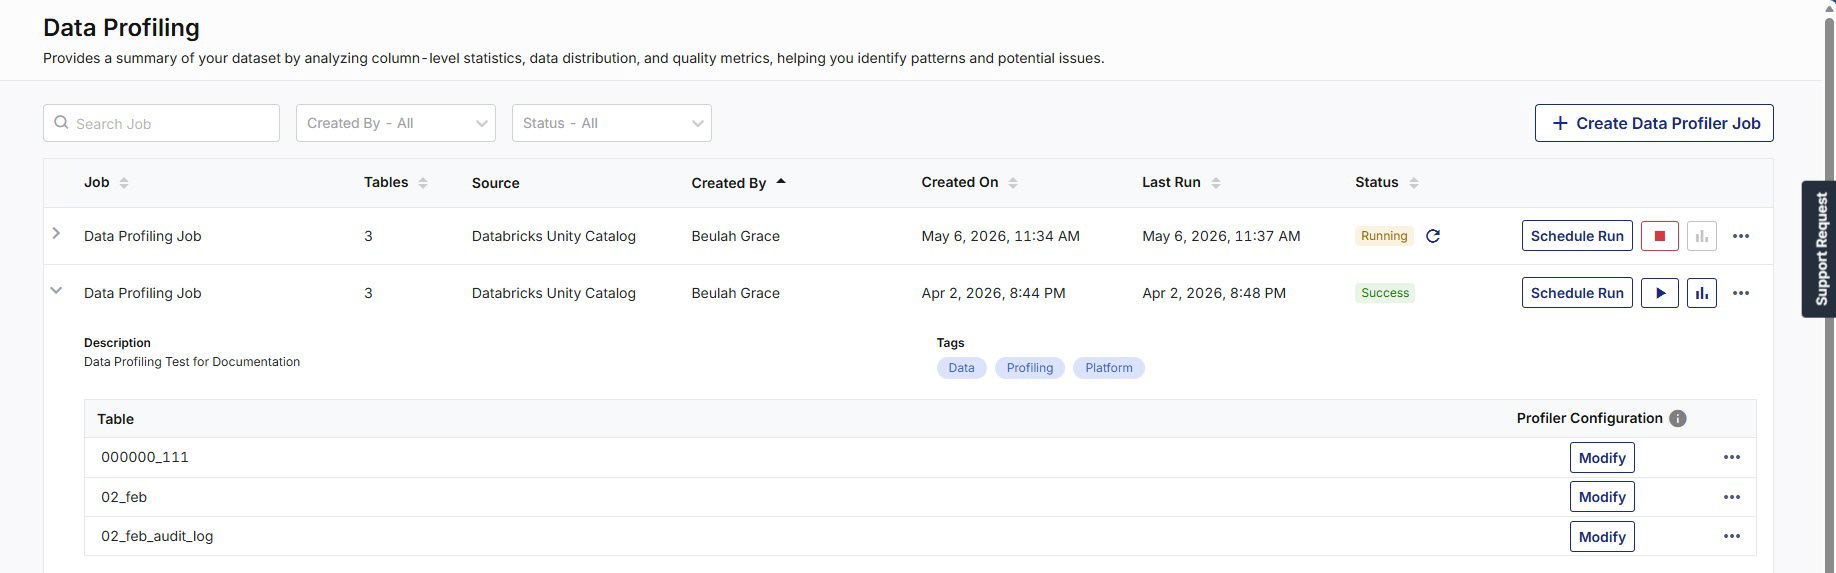
For the selected data profiler job, click the expand icon to review the job configuration summary.
-
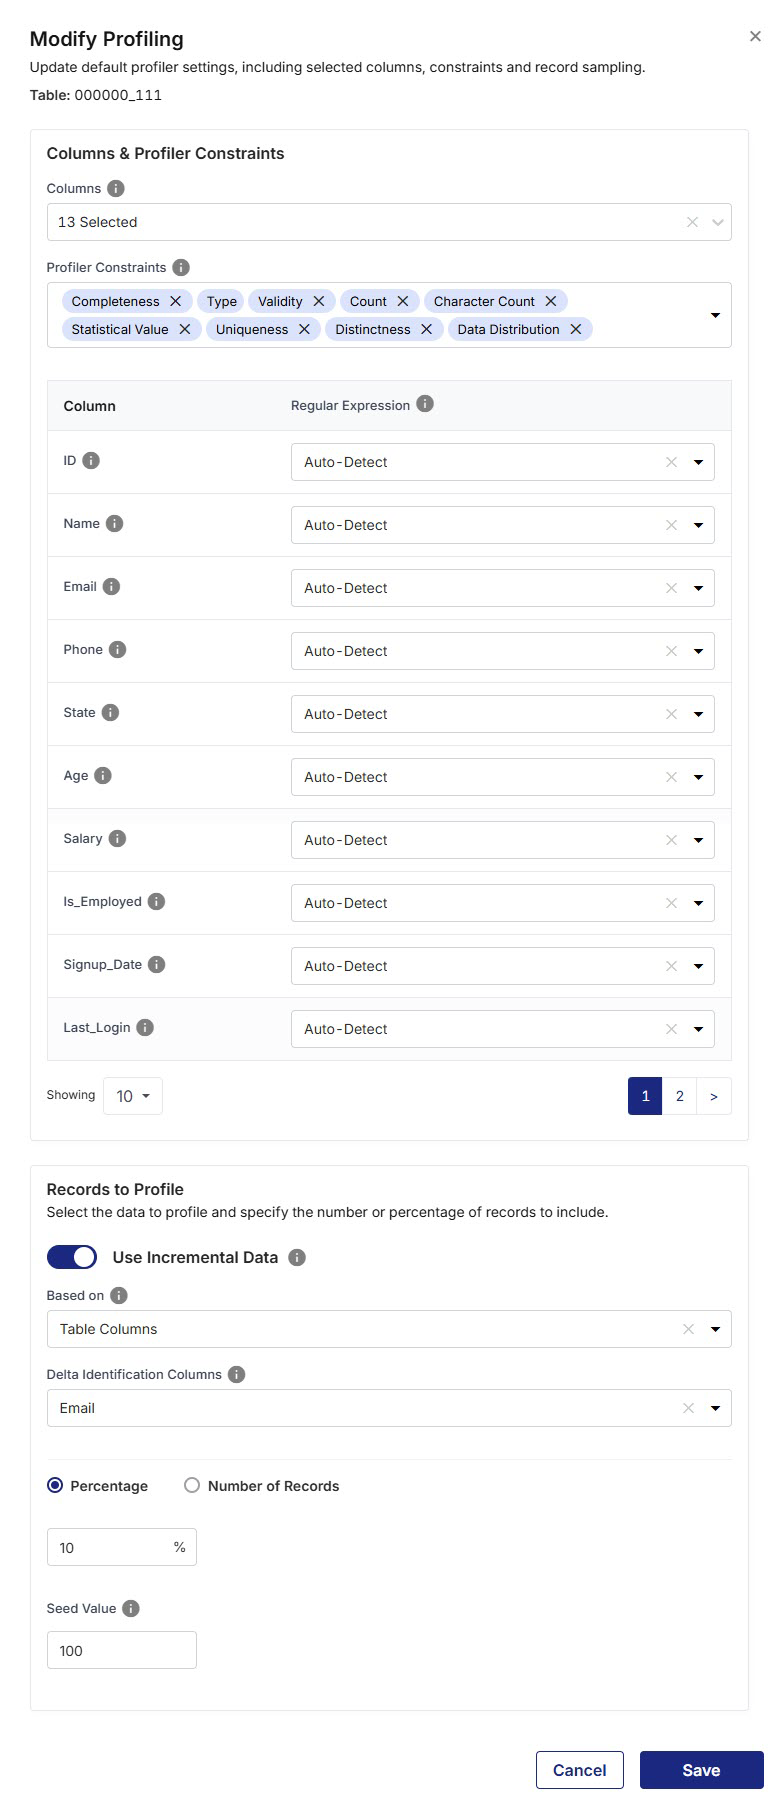
Under Profiler Configuration, click Modify next to the table you want to modify the profiler configuration. The Modify Profiling popup opens.
Note:
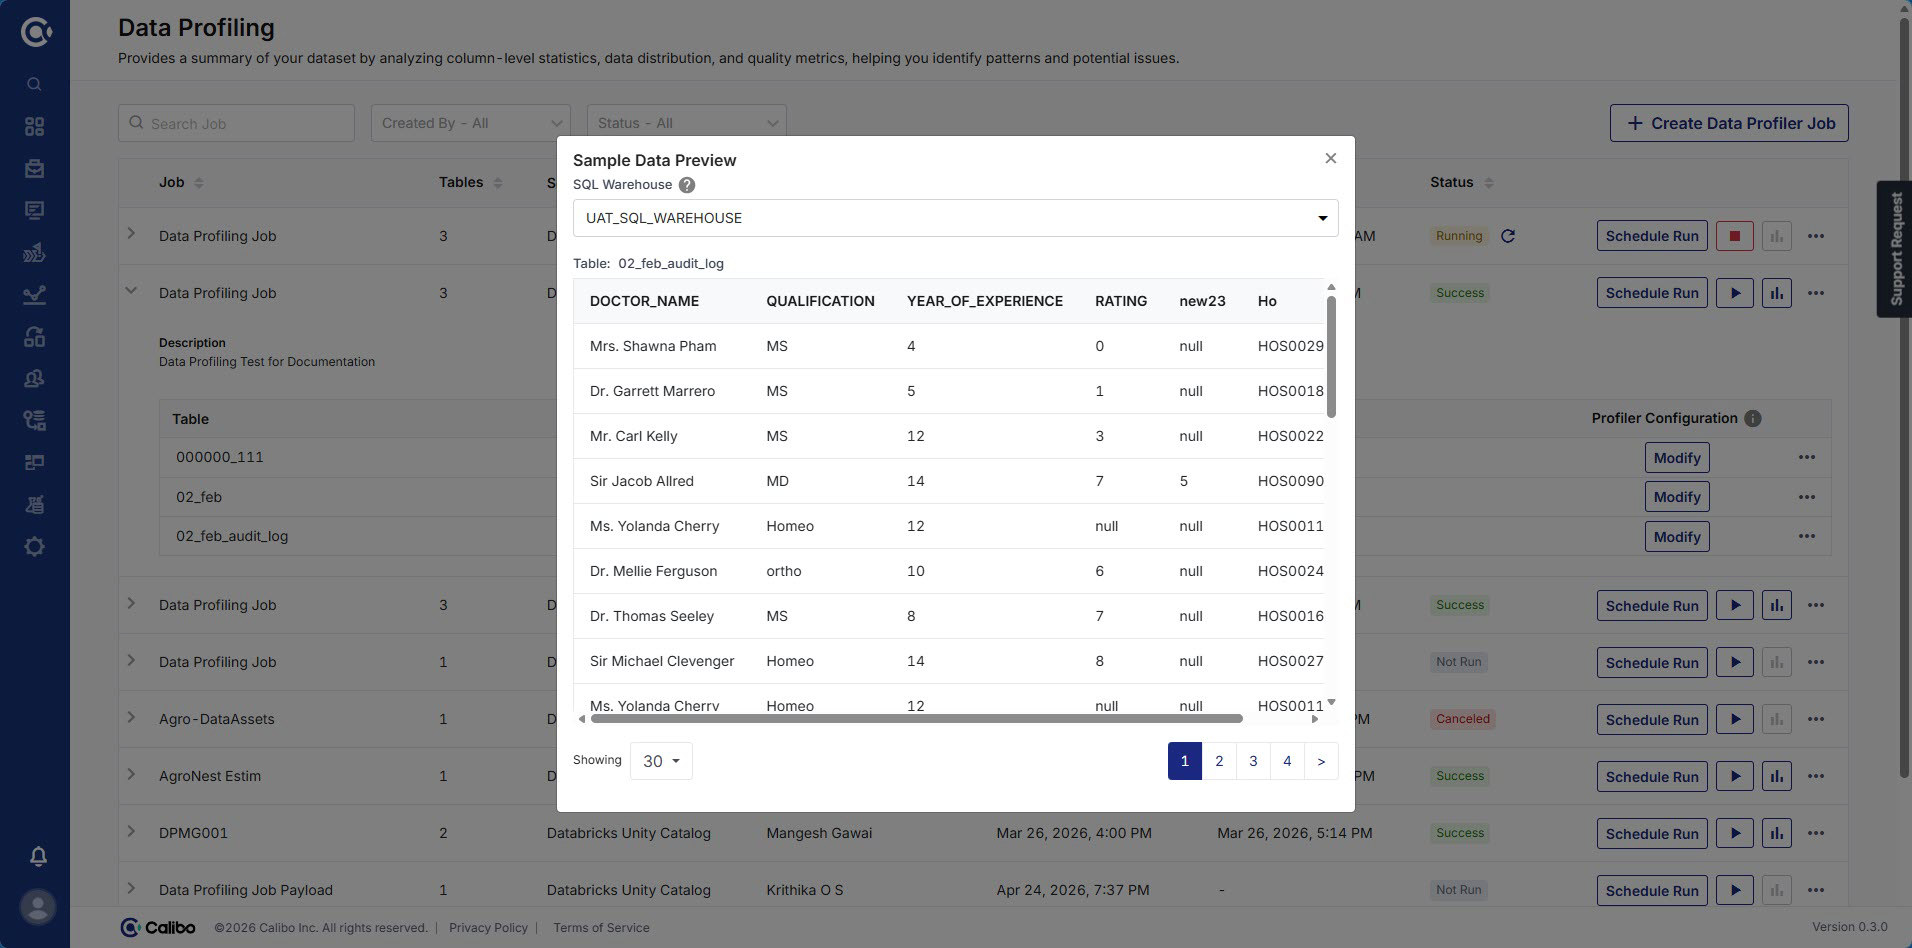
From the ellipses (…), click Sample Data Preview or Meta Data Preview next to each table to view a sample or meta data of that table respectively.
-
Update the following details as needed:
-
Columns: Select the required columns from the dropdown or Select All if you want to select all the columns at once.
-
Profiler Constraints: Select the required constraints on which you want the data profiler job to run or Select All if you want the data profiler job to run on all constraints.
Note:
Validity constraint will not be run for data types such as array, map, and struct.
-
Regular Expression: If you select Validity constraint, you must provide a regular expression for the selected columns. For example - NumbersOnly, LettersOnly, Numbers, Letters and so on or you can select Auto-Detect to identify the corresponding value automatically.
-
Records to Profile: Select a sample of records to be processed by the profiler job. Select one of the following options:
-
Use Incremental Data - Enable this option to use incremental data, else full data will be used. You can select the following as needed:
-
Based on - You can choose based on Table Versions (Change Data Feed) to automatically process incremental changes from Delta tables or Table Columns to select a column manually for processing of data from Delta tables.
-
Delta Identification Columns: Select a column (or set of columns) in the Databricks Delta Table that uniquely identifies each record and can be used as a reference for retrieving the latest version of the data.
-
-
Percentage - Provide a percentage of the total number of records to be processed by the profiler job.
-
Number of Records - Provide a number of the records that are to be processed by the profiler job.
-
-
Seed Value - A value that controls the sampling of records. Seed value generates the same sample dataset each time the job is run. Each seed value creates a sample dataset.
-
-
Click Save.
Note:
You can re-run the job to execute the data profiling on the updated data and generate updated results.
7. View Data Profiler Audit Logs
Calibo Accelerate provides a comprehensive audit logging system for Data Profiler to track all activities performed throughout the data profiling lifecycle. The audit logs capture every significant action, from Data Profiler creation and configuration through execution, scheduling, updates, and job completion across supported profiling platforms such as Snowflake and Databricks (DBX).The Data Profiler audit trail provides complete visibility into who performed an action, when it occurred, and what activities were executed. Audit records include operational and execution details such as profiler name, execution status, run identifiers, scheduling events, and related metadata. This enables organizations to maintain transparency, governance, compliance, accountability, and traceability for all Data Profiler activities while simplifying monitoring, troubleshooting, and operational oversight.
Viewing Data Profiler Audit Logs
To access Data Profiler audit logs, follow these steps:
-
Navigate to the Data Profiling screen by using one of the following methods:
-
From the required Product, click the ellipsis (…) and then click Data Profiling.
-
From the left navigation pane, select Data Lab > Data Profiling.
-
-
To view audit events for all Data Profilers:
-
On the top right corner of the Data Profiling screen, click the ellipsis (...), then click Audit History
-
-
To view audit events for a specific Data Profiler:
-
From the ellipsis (…) next to the required Data Profiler Job, click Audit History.
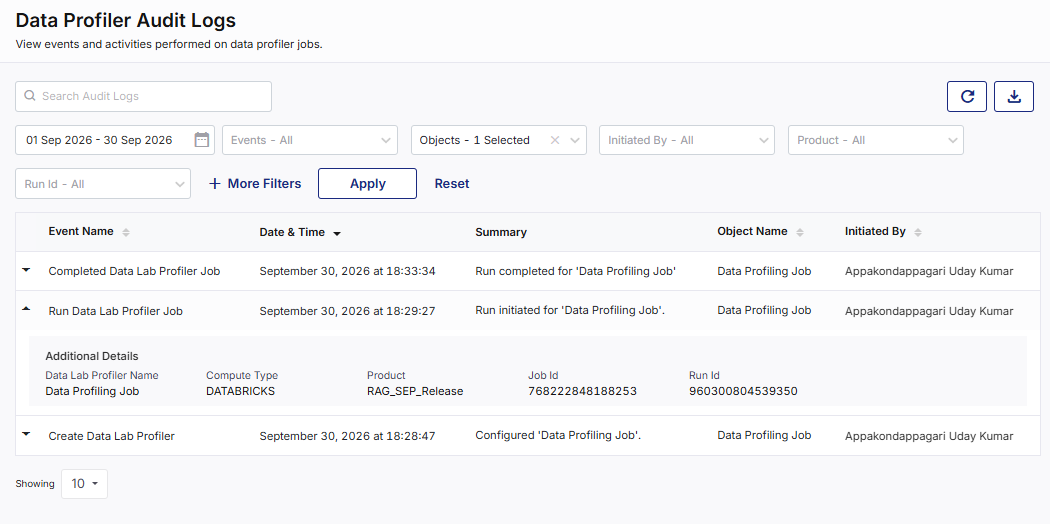
The Data Profiler Audit Logs page opens in a new tab.
-
-
On the Data Profiler Audit Logs screen, events are listed in reverse chronological order, with the most recent events appearing first.
-
Each audit log entry provides the following information:
-
Event Name: Displays the type of event performed.
For example: Create Data Lab Profiler, Update Data Lab Profiler, Run Data Lab Profiler Job, or Completed Data Lab Profiler Job.
-
Date & Time: Displays the date and time when the event occurred.
-
Summary: Provides a brief description of the activity performed.
-
Object Name: Displays the name of the Data Profiler associated with the event.
-
Initiated By: Displays the name of the user who performed the action.
-
Additional Details: Click the expanding arrow beside an event to view additional information. Depending on the type of event, additional details may include:
-
Data Lab Profiler Name
-
Compute Type
-
Product
-
Job Id
-
Run Id
-
-
Log Management and User Controls
Use the following features to efficiently search, filter, navigate, and export logs. These features enhance your audit log experience ensuring quick access to relevant information and better control over audit history.
Search and Filtering Options
To locate specific events quickly, use the following features:
-
Search Bar: Search for audit entries using keywords from the event summary or object name.
-
Date Range Selection: Filter events within a selected date range. By default, the last one week's events are displayed.
-
Events: Select specific event types to refine the displayed records.
-
Objects: Filter logs for specific Data Profilers.
-
Initiated By: Filter logs based on the user who initiated the event.
-
Product: Filter logs based on the product.
-
Run Id: Filter logs based on the Run Id.
-
More Filters: Displays additional filtering options for refining audit log results.
-
Click Apply to apply the selected filters and Reset to revert to default filter settings.
Additional Actions
-
Refresh: Click the refresh icon on the top right corner to update logs with the latest events.
-
Generate and Download Audit Logs Report:
-
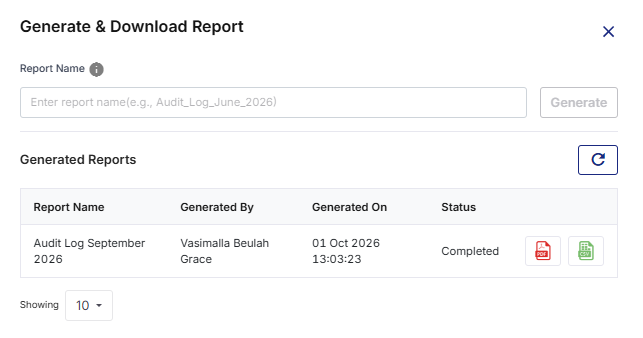
Click the Download icon on the top right corner. The Generate & Download Report side drawer opens.
-
In the Report Name field, enter a suitable name for the report.
-
Click Generate to create the report.
-
In the Generated Reports section, find the report available for download in the PDF or CSV format.
-
Note:
Pagination support is also available to view 10, 25, 30 or 50 reports per screen,
By leveraging Data Profiler Audit Logs, you gain complete visibility into the Data Profiling lifecycle, enabling effective monitoring, auditing, governance, compliance, and troubleshooting while ensuring accountability for all Data Profiling related activities within the organization.
Best Practices
-
Start with sampling for large datasets.
-
Apply Validity checks only to relevant columns.
-
Reuse profiling jobs for recurring analysis.
-
Use profiling results as a baseline for downstream data quality rules.
| Recommended Topics
|
What's next? Databricks Data Analyzer |