Agility Dashboard
The Agility tab of dashboards populates data related to the agile sprints for a particular team and product. The product should have joined a release that is part of a release train. The release should have sprints added to it.
-
Log on to the Calibo Accelerate platform and navigate to Dashboards > Agility tab.
-
Select a team, product and sprints for which you want to view the agile dashboard.

Note:
A private product is not visible in the dropdown for selection.
The KPIs of the agility dashboard provide the following information:


|
Open Issues - The total number of open defects across the selected sprints for the product. |

|
Velocity - The amount of work delivered by the team during the period of the selected sprints. |

|
Average Release Duration - The average of the total duration of the selected sprints. |

|
Mean Time for Bug - The average time required for fixing defects during the selected sprints. |

|
Average Release Hit Rate - The committed versus actual story points per release. |
The various widgets of the agility dashboard provide the following information:
| Dashboard Widget | Description |
|---|---|
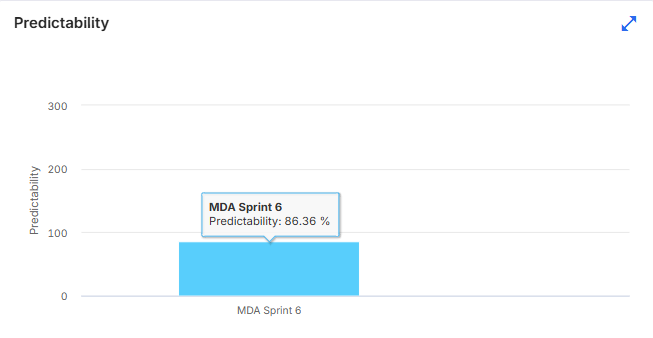
| Predictability shows the percentage of committed stories to completed stories for a sprint. In the adjacent image, the predictability is seen as 86.36%. |
|
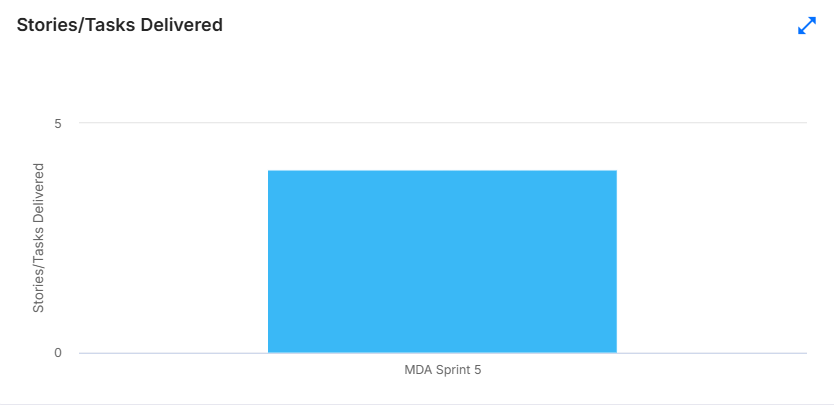
| Stories/Tasks Delivered shows the stories or tasks that are delivered in a sprint. |
|
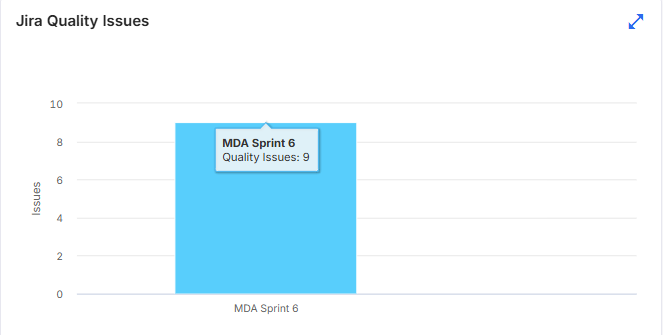
| Jira Quality Issues shows the defect logged for completed stories in a particular sprint. In the adjacent image, there are 9 defects in the particular sprint. |
|
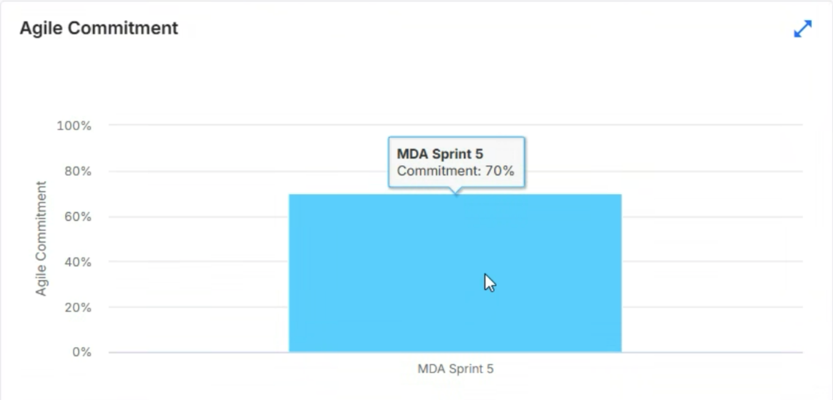
| Agile Commitment - shows the percentage of completed stories against the total capacity. |
|
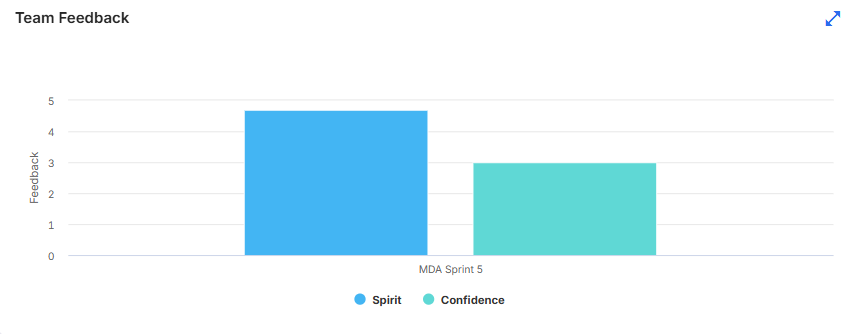
| Team Feedback - shows the score of team spirit and confidence of the team about other team members during the sprint. |
|
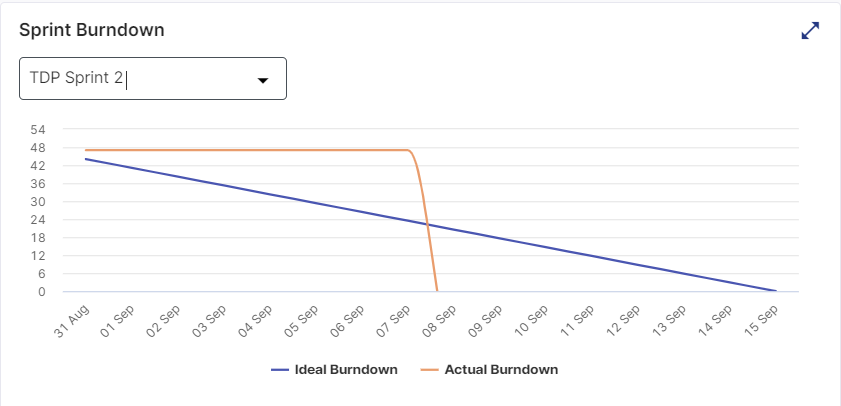
| Sprint Burndown shows the ideal versus actual burndown for the selected sprint. |
|
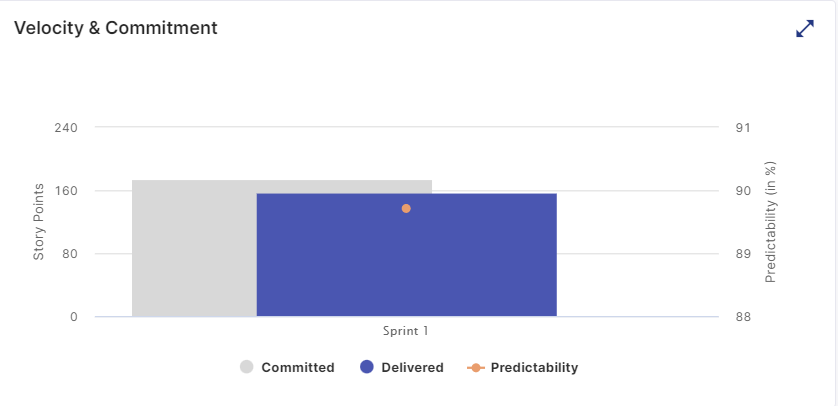
| Velocity & Commitment show the commitment versus actual velocity of the sprint in terms of story points. It also shows the predictability of the team in percentage. |
|
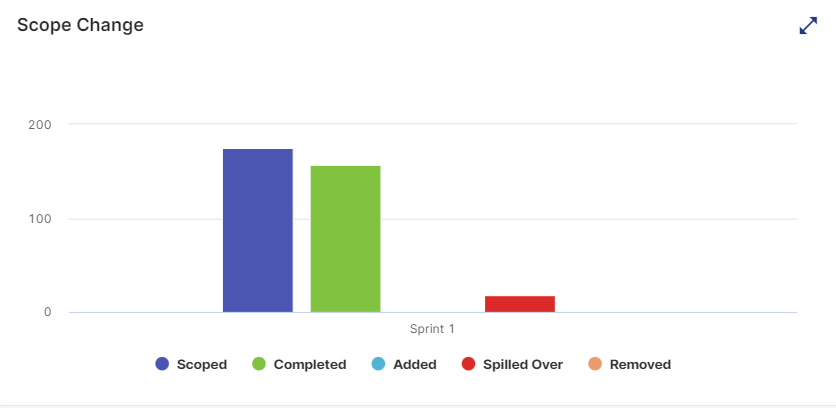
| Scope Change shows the statistics related to change in scope for a sprint in terms of story points - scoped, completed, added, removed, and spilled over. |
|
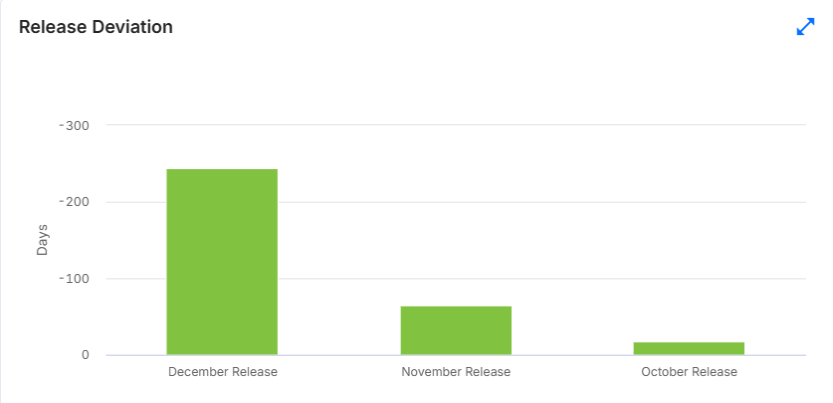
| Release Deviation shows the deviation in the number of days required to complete monthly sprints over a period of time. |
|
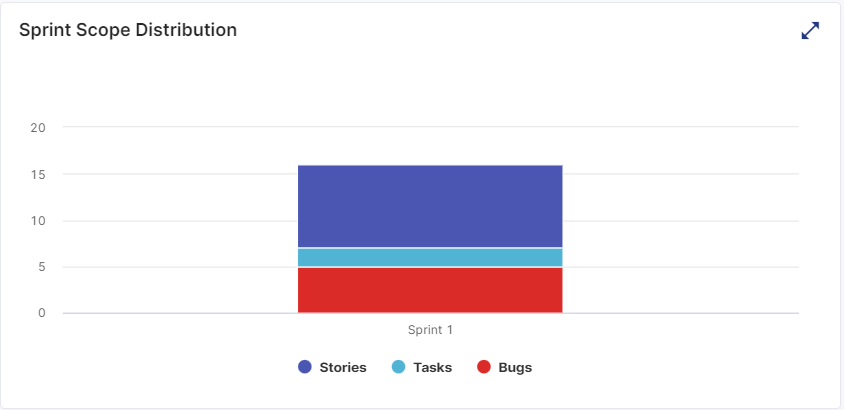
| Sprint Scope Distribution shows the distribution of scope of the sprint in terms of how much effort was spent on stories, tasks (??), and bugs. |
|
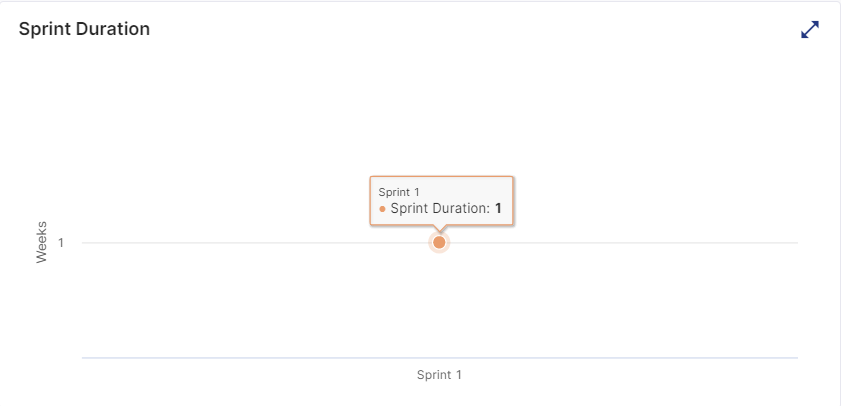
| Sprint Duration shows the duration of the selected sprint. |
|