Product Audit Logs
The Calibo Accelerate platform provides a comprehensive audit logging system to track all actions performed on a product. These audit logs help ensure transparency, security, and compliance by maintaining a clear record of activities associated with a product. Having a structured audit log improves governance, risk management, and accountability, allowing you to review past events, detect anomalies, and troubleshoot efficiently.
Product audit logs are categorized into two sections:
General Logs: All product-related events except tool provisioning are logged in this section.
Tool Provisioning Logs: Events related to providing or revoking tools access for users within the product team are captured in this section.
Viewing Product Audit Logs
To access product audit logs, follow these steps:
-
Sign in to the Calibo Accelerate platform and then, from the left navigation pane, click Products.
-
Select the product for which you want to check the audit history.
-
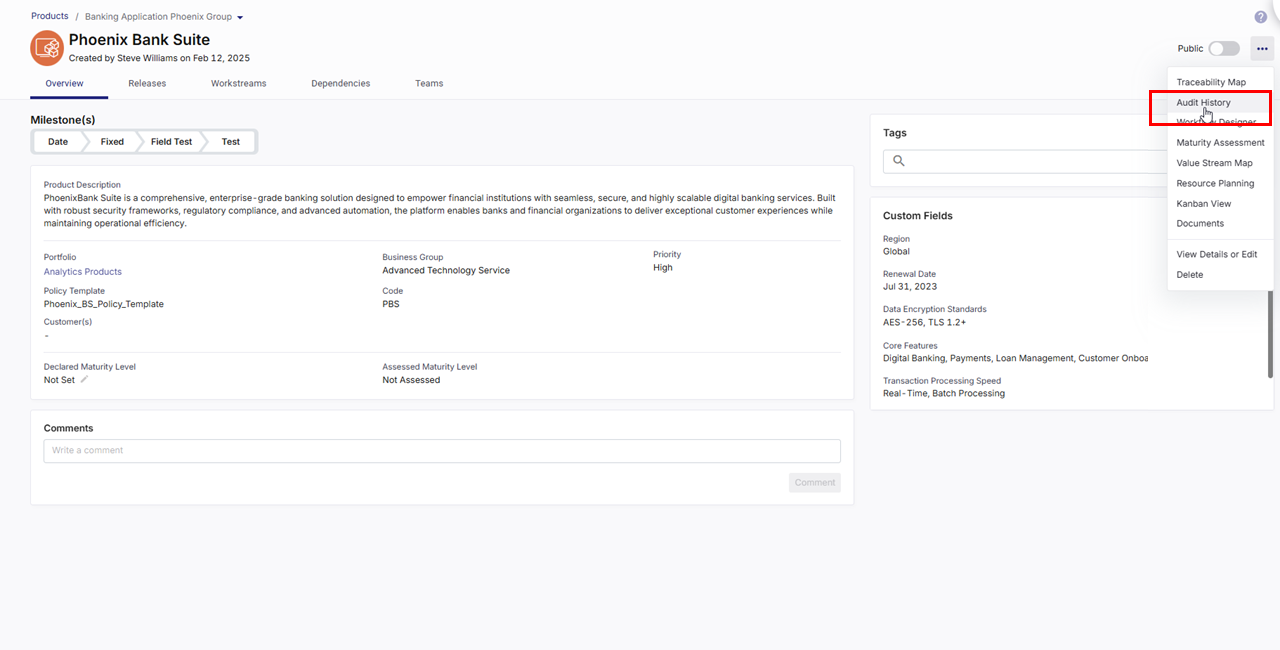
On the product screen, in the upper-right corner, click the ellipsis (...), and then in the dropdown menu, click Audit History.

-
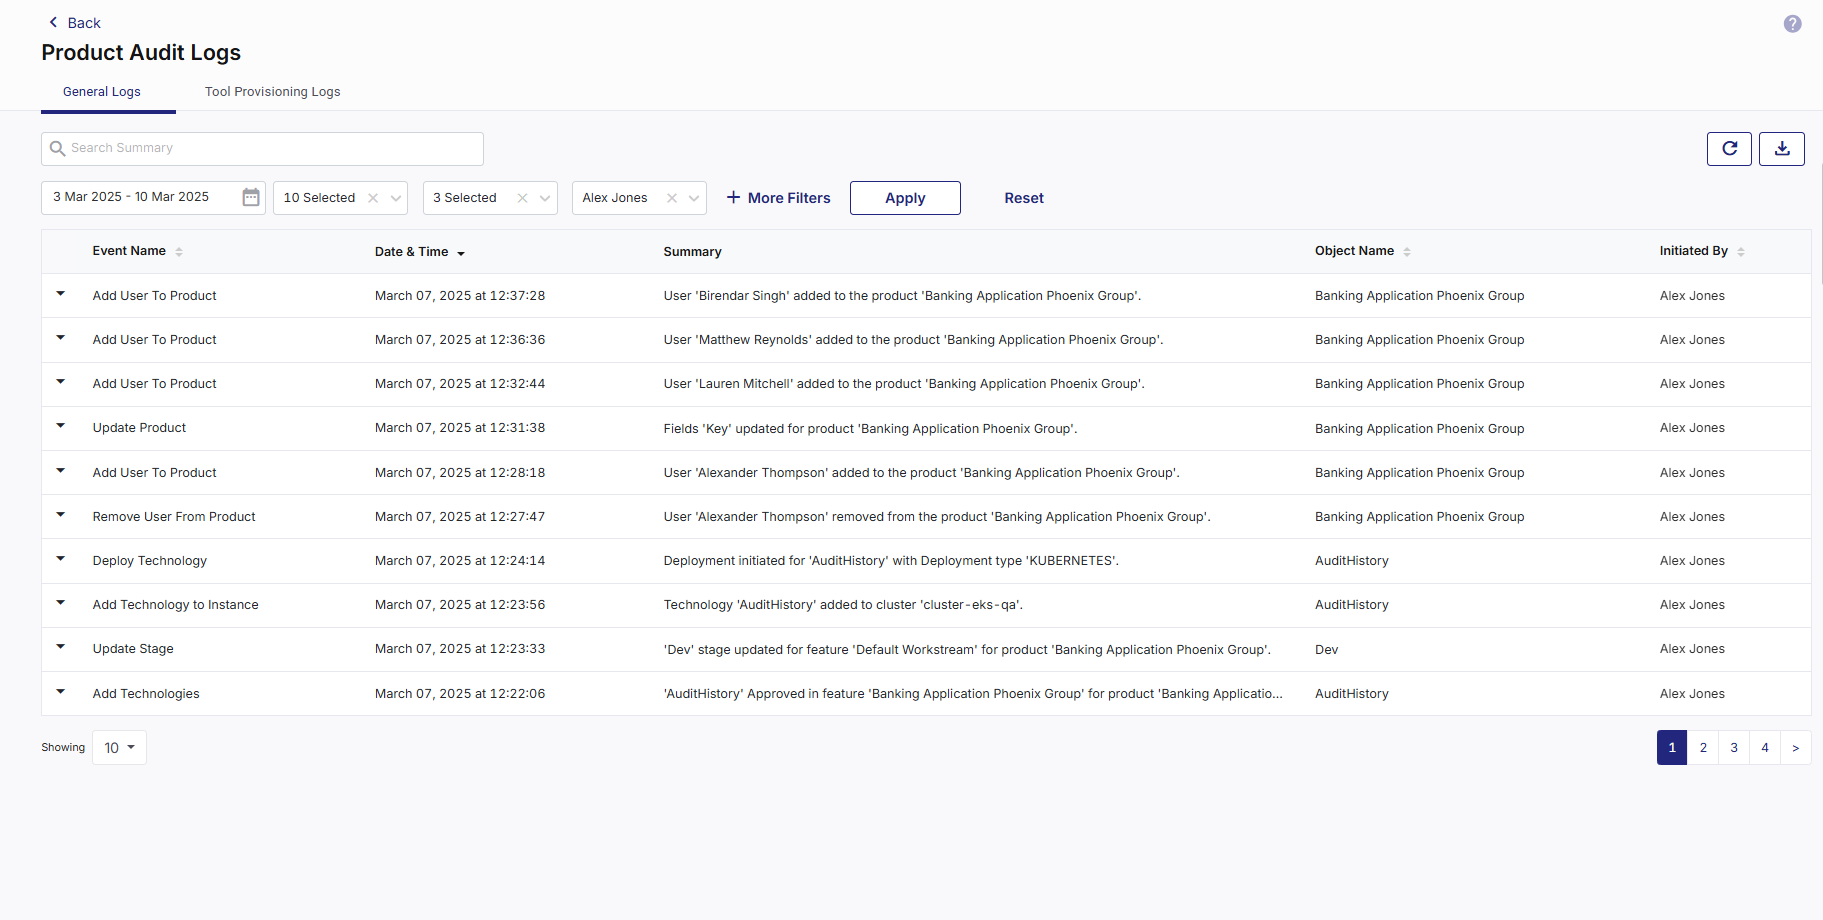
On the Product Audit Logs screen, logs are displayed under the following tabs:
 General Logs
The General Logs section records product events other than tools provisioning events. Events are listed in reverse chronological order, with the most recent events appearing first.

-
Data Fields in General Logs
The following data fields provide key details about each logged event, helping users track and analyze product-related activities effectively.
-
Event Name: Displays the event name; sorted alphabetically by default. You can toggle sorting order for event names to arrange them alphabetically or in reverse.
-
Date & Time: The timestamp when the event was logged.
-
Summary: A brief description of the event.
-
Object Name: The specific entity associated with the event.
-
Initiated By: Name of the user who performed the action.
-
-
Additional Details
Click the expander arrow preceding the Event Name column to view additional details such as the portfolio to which the product belongs, feature name, release, stage, username, and change details in case of an update event. These additional details vary depending on the event.
-
Log Management and User Controls
Use the following features to efficiently search, filter, navigate, and export logs. These features enhance your audit log experience ensuring quick access to relevant information and better control over audit history.
-
Search and Filtering Options
To locate specific events quickly, use the following features:
-
Search Bar: To search logs related to a specific event, enter keywords from the event summary in the search bar.
-
Date Range Selection: The date range picker allows filtering logs based on a custom time period. By default, the date range is set to the last one week.
-
Events Filter: Select specific event types to refine the displayed records.
-
Objects Filter: Choose specific objects to view related event records.
-
Users Filter: Filter logs based on the user who initiated the event.
-
More Filters: Click More Filters to view additional filtering options such as Release, Technology, Design Document, Feature, and Stage. Select the required criteria to refine event logs for a more targeted view.
Click Apply to apply selected filters and Reset to revert to default filter settings.
-
Records per screen: You can select 10, 25, 30, or 50 event records per screen.
-
Pagination: Navigate through multiple pages of logs using numbered page selectors.
-
-
Additional Actions:
-
Refresh Logs:Click the Refresh icon in the upper-right corner to update logs with the latest events.
-
Download Log Report:
-
Click the Download icon in the upper-right corner.
-
In the Download Report side drawer, in the Report Name field, enter a suitable name for the report.
-
Click Generate to create the report.
-
In the Generated Reports section, find the report available for download in PDF or CSV format.
-
View 10, 25, 30, or 50 reports per screen. Pagination support is also available.
-
-
-
By leveraging Product Audit Logs, you gain a robust system for tracking, analyzing, and securing product-related activities, ensuring better governance, risk management, and accountability within the organization.
 Tool Provisioning Logs
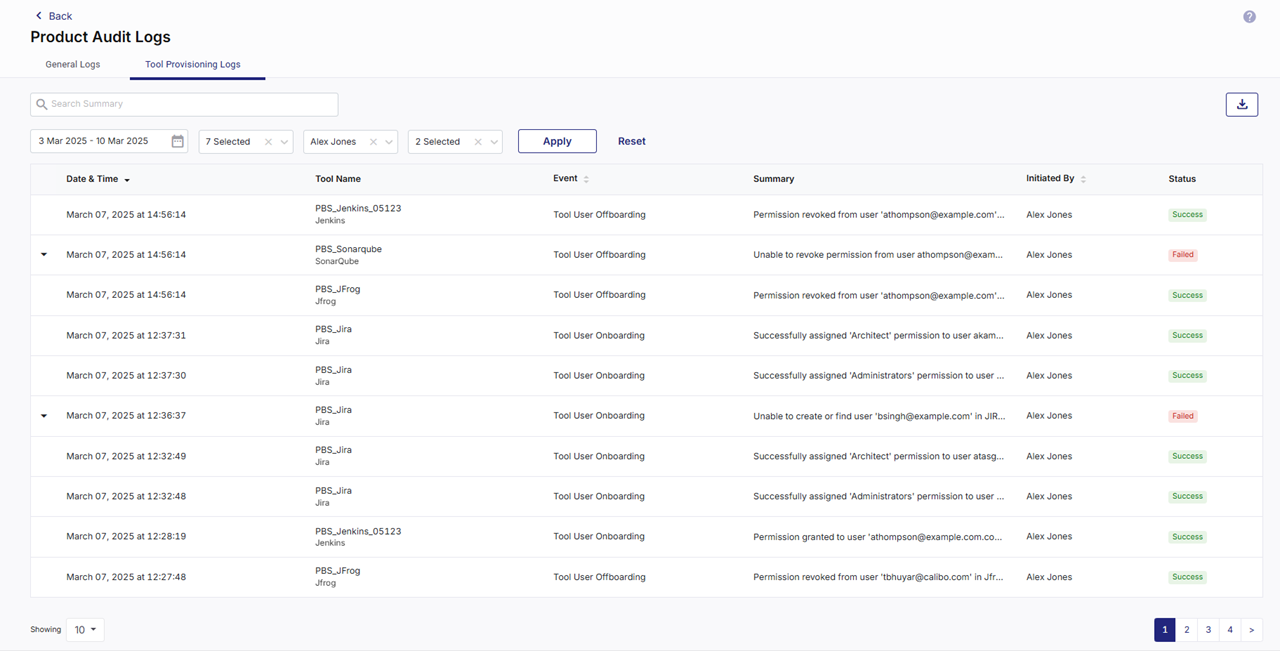
The Tool Provisioning Logs section records tool access provided to a user or tool access revoked for a user. These tools include data tools and DevOps tools supported in system-defined and custom product roles in the platform. See Roles in Calibo Accelerate platform.
This ensures visibility into changes related to access permissions and user roles within external tools.

-
Data Fields in Tool Provisioning Logs
-
Date & Time: The timestamp when the event was logged.
-
Tool Name: The name of the provisioned tool, for example, Jenkins, Jira, SonarQube. This includes the tool name and the name by which you save the tool configuration in the Calibo Accelerate platform
-
Event: The action performed, for example, Tool User Onboarding, Tool User Offboarding.
-
Summary: A description of the event, including permission assignments or revocations.
-
Initiated By: The user who performed the action.
-
Status: Indicates whether the event was successful or failed.
-
-
Log Management and User Controls
The Calibo Accelerate platform offers several additional features to enhance the audit log experience. These functionalities allow users to efficiently search, filter, navigate, and export logs, ensuring quick access to relevant information and better control over audit history.
-
Search and Filtering Options
To locate specific events quickly, use the following features:
-
Search Bar: To search logs related to a specific event, enter keywords from the event summary in the search bar.
-
Date Range Selection: The date range picker allows filtering logs based on a custom time period. By default, the date range is set to the last one week.
-
Tools Filter: All tools for which events are logged are available. You can select specific tools to refine search.
-
Users Filter: Select specific users and view logs related to actions performed by them.
-
Events Filter: Select specific event types to refine the displayed records.
Select the required criteria to refine event logs for a more targeted view.
Click Apply to apply selected filters and Reset to revert to default filter settings.
-
Records per screen: You can select 10, 25, 30, or 50 event records per screen.
-
Pagination: Navigate through multiple pages of logs using numbered page selectors.
Additionally, you can click the
 icon to export the tools provisioning logs to a CSV file.
 -
-
-
|
What's next?View Product Options |